

AI Fairness Audit Metrics: What to Measure and How to Interpret Results
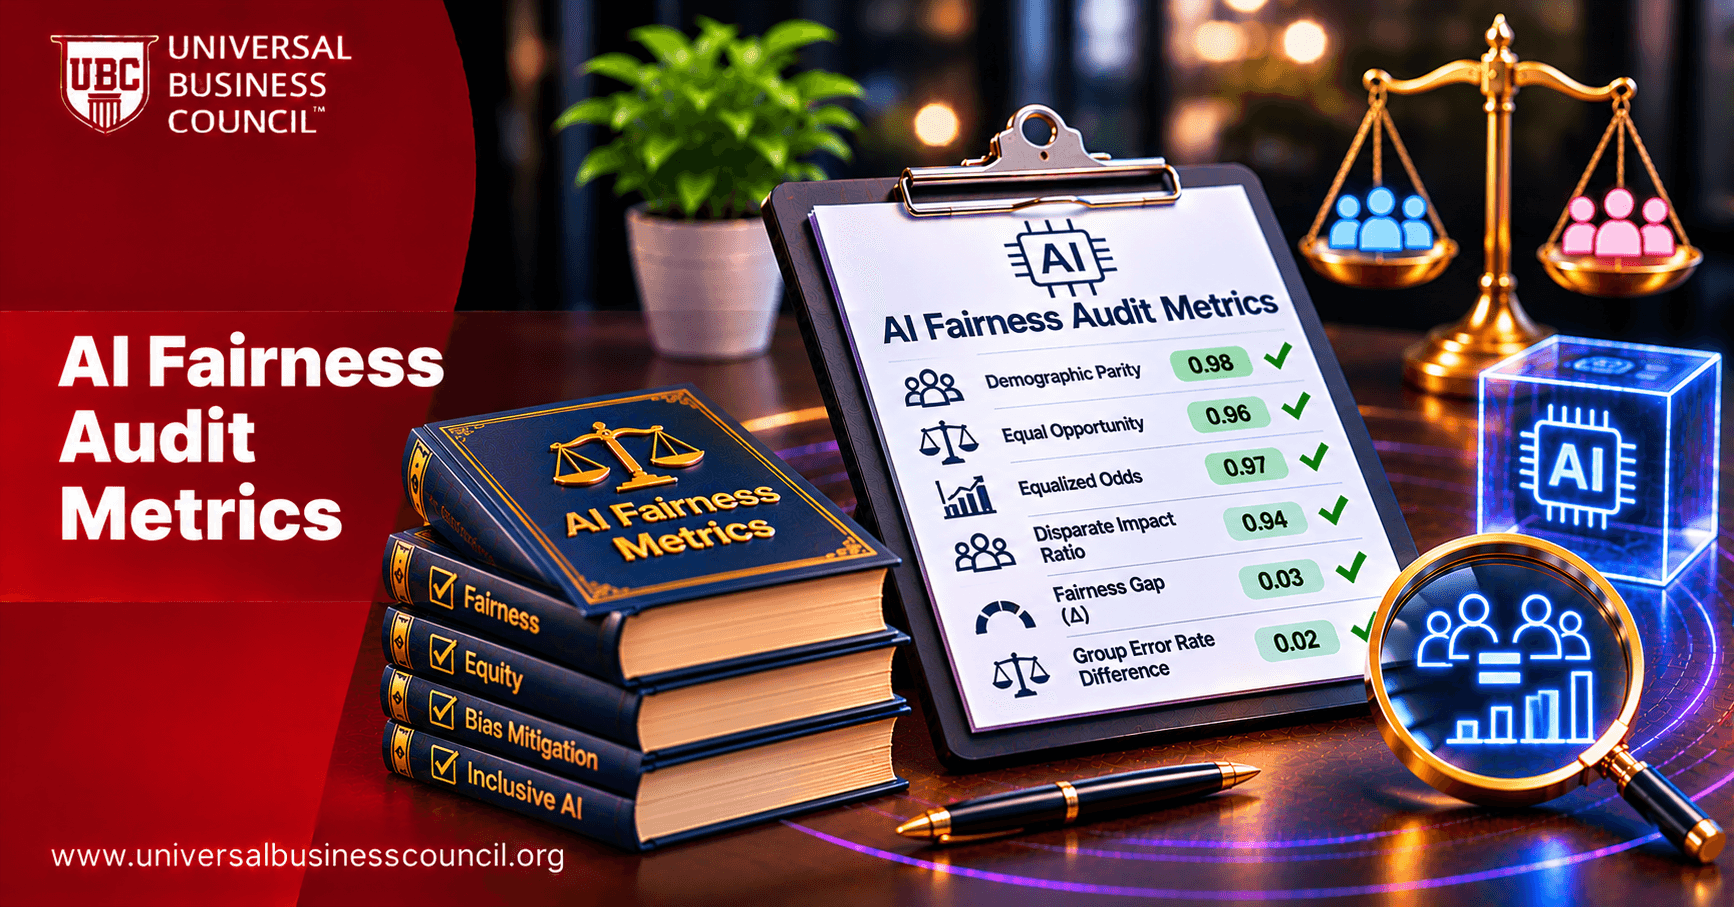
Researchers have written down dozens of mathematical definitions of fairness, and several of them cannot be satisfied at the same time. That single fact explains why fairness audits so often end in an argument about which number to trust. This guide walks through the main AI fairness audit metrics, shows how to pick the right ones for the harm you care about and explains how to read the results without fooling yourself. If you plan to run these audits as a professional, the Certified AI Audit Professional program from Universal Business Council is a useful next step.
What are AI fairness audit metrics?
AI fairness audit metrics are numerical measures that compare how an AI system treats different groups of people, such as how often each group receives a favorable decision or how often the system makes mistakes about them. Auditors compute them on real or test data, compare the gaps and judge whether the differences are acceptable and explainable.

No metric proves fairness. Each one captures a single idea of fairness and ignores others. The skill lies in choosing the idea that fits the harm.
The main metrics at a glance
Metric | What it compares | Good fit when | Blind spot |
Demographic parity | Share of each group getting a favorable outcome | Access itself is the concern, such as who sees an offer | Ignores whether groups differ in true qualifications |
Disparate impact ratio | Lowest group selection rate divided by highest | Employment-style screening | Same blind spot as demographic parity |
Equal opportunity | True positive rate across groups | Qualified people should be treated alike, as in lending or hiring | Says nothing about false positives |
False positive rate parity | How often people are wrongly flagged | Harm comes from wrongful flagging, such as fraud holds or content takedowns | Ignores missed cases |
Equalized odds | Both true positive and false positive rates | Both kinds of error matter | Hard to satisfy exactly |
Predictive parity | Precision across groups: when the model says yes, how often is it right | Decisions depend on trusting a positive score | Can coexist with unequal error rates |
Calibration by group | Whether a score of 0.7 means 70 percent for everyone | Scores are used as probabilities | Can hide unequal errors at a given threshold |
Individual fairness | Whether similar people get similar results | Case-by-case consistency matters | Needs a sensible measure of similarity |
Why you cannot have them all
Work by Alexandra Chouldechova and by Jon Kleinberg and colleagues showed that when groups have different underlying base rates, a score cannot be perfectly calibrated and also have equal error rates across groups, except in trivial cases. In plain terms, improving one fairness measure can worsen another.
That is not a failure of your audit. It is a property of the problem. It means someone has to decide which notion of fairness the system should honor, and that decision belongs in writing, with a reason.
Pick metrics by the harm, not by habit
Start with the question: what goes wrong for a person when this system errs?
Hiring screen: being filtered out when qualified. Look at equal opportunity and selection rate ratios.
Loan approval: being denied despite being creditworthy, and being approved for a loan you cannot repay. Look at equal opportunity, false positive parity and calibration.
Medical screening: a missed condition. Look at false negative rates by group first.
Fraud or abuse detection: being wrongly blocked or removed. Look at false positive rate parity.
Ad or offer delivery: being left out of an opportunity. Look at demographic parity and reach by group.
Choose the metrics before you see the results. Picking after the fact lets a hopeful auditor find a flattering number every time.
A small example you can follow
These numbers are invented to show the arithmetic. A lending model reviews 80 creditworthy applicants in Group A and approves 64. It reviews 50 creditworthy applicants in Group B and approves 30.
True positive rate, Group A: 64 divided by 80 is 0.80
True positive rate, Group B: 30 divided by 50 is 0.60
Equal opportunity difference: 0.20
Creditworthy applicants in Group B are approved far less often. That gap deserves attention even if overall approval rates look similar. The next step is to ask why: is the training data thinner for Group B, are certain features noisier for them or does a threshold hit them harder?
Reading the numbers
Size and direction
A gap of 0.02 and a gap of 0.20 are different stories. Also note who is favored. A pattern that disadvantages a group already facing barriers deserves extra weight.
Uncertainty
Small groups produce shaky numbers. Report sample sizes and confidence intervals, and do not overread a gap that sits inside the noise.
Thresholds for action
No universal cutoff exists. The 0.8 figure from US employment practice is a screening rule for selection rates, not a general fairness standard. Agree on tolerances with risk and legal teams before the audit, write them into policy and apply them consistently.
Subgroups and aggregation
Aggregated numbers can hide opposite patterns inside subgroups, a trap known as Simpson's paradox. Slice by relevant factors, including combinations such as sex and age band together, as long as the sample is large enough.
Traps that spoil audits
Trusting labels that are themselves biased, such as past arrest records or prior hiring decisions used as ground truth
Testing on data that differs from the population the system really serves
Treating a pass on one metric as a clean bill of health
Ignoring how humans use the output, which can undo or magnify a gap
Fixing the metric instead of the cause, such as shifting thresholds to hit a ratio without asking why the gap exists
Reporting results people can use
Lead with the decision and the harm, then give the metrics chosen and why. Show gaps with uncertainty, say what you could not test and state which trade-offs were accepted and by whom. A short table with plain-language notes beats a dashboard of unlabelled charts. Rerun the same metrics on a schedule so changes over time are visible.
Beyond hiring and lending
The same measures apply to personalization, ad delivery and audience segmentation. Marketing analysts can use them to check who actually sees an offer. Those who want to explore that side of the work can look at the Certified Digital Marketing Expert program.
Skills, tools and records
Computing these metrics takes comfort with data and statistics. The programming and technology certifications from Global Tech Council can help build that base, and open-source libraries such as Fairlearn and AI Fairness 360 cover the calculations. Audit data and results are worth protecting from quiet edits, and teams curious about tamper-evident approaches can explore the deep tech certifications from Blockchain Council. When you hire analysts for this work, a quick skills test shows who is ready, and HireValid offers AI-proof pre-employment tests with an Integrity Score that supports human review.
Conclusion: choosing and reading AI fairness audit metrics well
AI fairness audit metrics compare how a system treats different groups, but each metric captures only one idea of fairness. Demographic parity and the disparate impact ratio compare selection rates, equal opportunity compares true positive rates, false positive rate parity looks at wrongful flags, equalized odds combines both error types, predictive parity and calibration check whether scores mean the same thing across groups, and individual fairness asks whether similar people are treated alike.
Because published research shows these measures cannot all hold together when base rates differ, the audit must choose by harm, decide before seeing results and record the trade-off. Reading results means looking at the size and direction of gaps, reporting uncertainty, setting action thresholds in advance, slicing by subgroups and avoiding traps such as biased labels, unrepresentative test data and fixing the number instead of the cause. Try it on one system: write down the harm, pick two metrics, compute them by group and note what the gap tells you. The Certified AI Audit Professional program mentioned at the start can help your team turn those steps into a repeatable review of AI fairness audit metrics.
FAQs
1. What are AI fairness audit metrics?
Numerical measures that compare outcomes or errors across groups to check whether a system treats them fairly.
2. What is demographic parity?
The idea that each group should receive favorable outcomes at similar rates.
3. What is equal opportunity?
Qualified people from every group should have the same chance of a favorable decision, measured by true positive rate.
4. What is equalized odds?
Equal true positive and false positive rates across groups.
5. What is predictive parity?
When the model says yes, it should be right equally often for each group.
6. What is calibration?
A score should mean the same probability for everyone, such as 0.7 meaning about 70 percent.
7. Can all fairness metrics be satisfied at once?
Generally no, especially when groups have different base rates.
8. How do we choose which metric to use?
Start from the harm a wrong decision causes, then pick metrics that track it.
9. What is the four-fifths rule?
A US employment rule of thumb that flags selection-rate ratios under 0.8.
10. Is there a universal pass mark?
No. Set tolerances in advance with risk and legal teams.
11. What sample size is enough?
Enough for stable results. Report intervals, and flag groups that are too small.
12. What is Simpson's paradox?
A pattern in combined data that reverses inside subgroups.
13. What is individual fairness?
The principle that similar individuals should receive similar outcomes.
14. Why choose metrics before seeing results?
It prevents picking whichever number looks best afterward.
15. Can biased labels distort metrics?
Yes. If ground truth reflects past bias, metrics can look fine while harm continues.
16. Do fairness metrics work for generative AI?
Partly. They fit classification-style tasks, while generative systems need paired prompts and output review.
17. Should we adjust thresholds to hit a target?
Only after finding the cause and weighing trade-offs. Changing the number alone can hide the problem.
18. How often should we recompute them?
On a schedule and after any change to the model, data or use.
19. What tools calculate them?
Fairlearn, AI Fairness 360 and similar open-source libraries.
20. Where can I learn more?
The Certified AI Audit Professional program and the documentation and papers behind the common fairness libraries.
Related Articles
View All
Artificial Intelligence
AI Ethics Audit: Evaluating Fairness, Transparency and Accountability
Explore what an AI ethics audit involves and how organizations evaluate AI systems for fairness, transparency, accountability, privacy, and potential bias. Learn about key audit areas, assessment methods, and how ethical reviews help identify concerns and support responsible AI development and deployment.

Artificial Intelligence
AI Model Monitoring: Performance, Fairness and Safety Metrics
Learn how AI model monitoring helps organizations maintain reliable, fair, and safe AI systems after deployment. Explore key metrics for tracking model performance, accuracy, bias, fairness, security, and safety, along with monitoring practices that help identify issues and support responsible AI management.

Artificial Intelligence
AI Security Audit: Assessing Models, Data, APIs and Infrastructure
Learn how an AI security audit evaluates the protection of AI systems against cyber threats, vulnerabilities, and unauthorized access. Explore key audit areas, including data security, model protection, access controls, adversarial attacks, and system vulnerabilities, along with methods for identifying risks and strengthening AI security.
Trending Articles
The Role of Blockchain in Ethical AI Development
How blockchain technology is being used to promote transparency and accountability in artificial intelligence systems.
AWS Career Roadmap
A step-by-step guide to building a successful career in Amazon Web Services cloud computing.
Top 5 DeFi Platforms
Explore the leading decentralized finance platforms and what makes each one unique in the evolving DeFi landscape.