

Six Sigma DMAIC Example: From Problem Statement to Control Plan
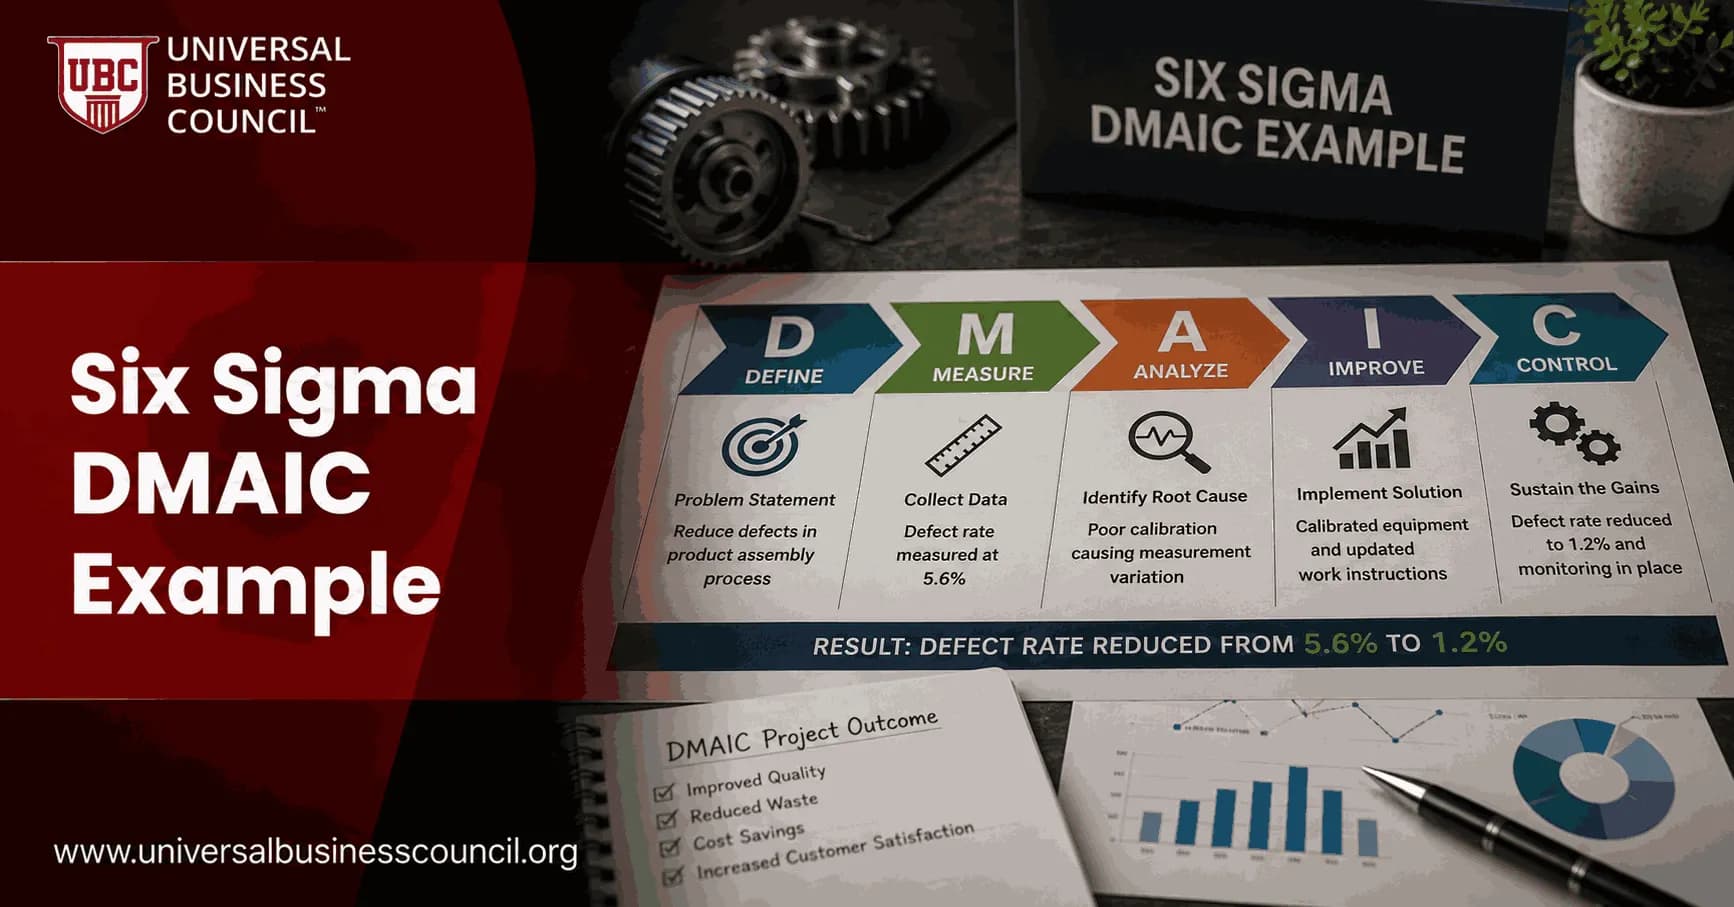
A Six Sigma DMAIC example only becomes useful when it shows the full path: a measurable problem statement, a clean baseline, proven root causes, tested improvements, and a control plan that people actually use after the project team leaves. That last part matters. I have watched teams build a 14-column control plan that looked impressive in a review meeting, then fail because the night-shift supervisor had no clear reaction step when a control chart crossed the limit. For professionals building structured process improvement expertise, a Certified Six Sigma Expert pathway can help connect these concepts with practical Six Sigma project work.
DMAIC stands for Define, Measure, Analyze, Improve, and Control. ASQ and other quality bodies still treat it as the standard Six Sigma project method because it forces you to move from opinion to evidence. Used well, it works in factories, finance teams, healthcare processes, IT support, and shared services.

Define: Write a Problem Statement That Can Be Measured
The Define phase sets the contract for the project. Keep the problem statement tight. One sentence is usually enough.
A weak statement says: Invoice quality is poor and customers are unhappy.
A stronger DMAIC problem statement says: From January to March, billing errors affected 7.8 percent of B2B invoices in the enterprise accounts process, causing customer complaints, credit notes, and rework; this project will reduce billing errors by 50 percent within 90 days.
Good problem statements include:
What is wrong: defects, errors, delays, scrap, downtime, or variation.
Where and when it happens: product line, region, system, shift, or process step.
Baseline performance: error rate, Cpk, OEE, cycle time, churn, or complaint count.
Business impact: cost, customer pain, compliance risk, lost capacity, or rework.
Target: a measurable goal and timeframe.
The project charter should also capture scope, milestones, team roles, sponsor, Voice of the Customer inputs, and a SIPOC map. If you are preparing for a Universal Business Council Six Sigma certification course, this is where many candidates lose marks: they describe symptoms but never quantify the gap.
Measure: Prove the Baseline Before You Fix Anything
Do not rush this phase. Bad data makes smart people chase the wrong cause.
In a manufacturing DMAIC case, the team might start with a critical product line showing a baseline Cpk of 0.49. That means the process cannot meet specification limits consistently. In a service process, the baseline might be a 7.8 percent billing error rate. On a food production line, it might be OEE stuck at 83 percent.
The Measure phase usually includes:
A data collection plan that defines what, where, when, how often, and by whom.
Measurement system analysis, such as Gage R&R, when physical measurements are involved.
Baseline charts, defect counts, cycle time distributions, or capability studies.
A check that data definitions are consistent across shifts, teams, or systems.
One practical tip: audit the data entry field before you trust the dashboard. I once found that an apparent spike in defects came from operators using the same downtime code for three different problems, because the correct codes were buried two screens down.
Analyze: Find the Few Causes That Matter
The Analyze phase separates likely causes from proven causes. Start broad, then narrow.
Common tools include Pareto charts, fishbone diagrams, 5 Whys, scatter plots, regression analysis, and hypothesis tests. A Pareto chart often gives the first useful lead. If three defect types create 80 percent of the loss, do not spend weeks improving the remaining 20 percent.
In the Cpk example, analysis may show that most variation comes from three root causes: a machine setting that drifts after changeover, inconsistent material temperature, and an operator inspection method that differs by shift. That is a very different project from a vague plan to add more final inspection.
Improve: Test the Fix Before You Standardize It
The Improve phase should validate solutions with data, not enthusiasm. Use pilot runs, before-and-after comparisons, Design of Experiments, and FMEA where the risk is material.
For the manufacturing example, the team could use Design of Experiments to identify optimal process settings, then run a pilot across multiple shifts. Published DMAIC examples have shown Cpk improving from 0.49 to 1.28 after targeted parameter changes and process controls. That kind of improvement matters because it reduces variation, not just visible defects.
For a service process, improvement may include system field validation, clearer approval rules, revised training, or removing duplicate handoffs. Be careful with training as the only fix. Training fades. System controls and standard work usually last longer.
When DMAIC work expands into leadership, workflow ownership, and cross-functional improvement, Management Certifications can complement the process improvement skills needed to sustain those changes.
Control: Build a Control Plan People Will Follow
The Control phase is where DMAIC results either hold or decay. The control plan is the operating agreement for the improved process.
What a DMAIC Control Plan Should Include
Process step: the specific step being controlled.
Critical input or output: the X or Y that affects the CTQ requirement.
Specification and control limits: target, upper limit, lower limit, or rule.
Measurement method: manual check, system report, sensor, audit, or control chart.
Sampling plan: frequency, sample size, and location.
Owner: a named role, not a vague department.
Reaction plan: what to do when the measure goes out of control.
Documentation: updated SOPs, work instructions, training records, and dashboard links.
Review cycle: daily review for live metrics, plus a 30, 60, or 90-day sustainability check.
Keep it short. A one-page control plan with five critical checks beats a bloated document with 40 measures nobody trusts. The reaction plan is the part I inspect first. If it says only notify manager, it is not enough. It should state containment, investigation, escalation, and restart criteria.
Common DMAIC Mistakes to Avoid
Starting with a solution instead of a quantified problem.
Skipping measurement system validation.
Using averages only, while ignoring variation and outliers.
Adding controls that operators cannot complete during real workload.
Failing to transfer ownership from the project team to the process owner.
Modern DMAIC projects increasingly use Google Looker Studio, Power BI, MES data, ERP reports, automated sensors, and visual boards for control. That helps, but dashboards do not replace accountability. Someone still has to respond when the trend turns red.
As digital systems become more central to DMAIC projects, technical knowledge can also help improvement teams understand automation, connected workflows, data infrastructure, and emerging technologies. Deep Tech Certification can provide complementary technology-focused learning for professionals working across these areas.
Your Next Step
Use this Six Sigma DMAIC example as a template for your next improvement project. Write one quantified problem statement, build a simple charter, validate the baseline, and draft the control plan before you start testing fixes. If you are formalizing your skills, connect this work to Universal Business Council Six Sigma training or a related quality management certification pathway so your project evidence matches recognized professional standards.
For professionals who want to strengthen their understanding of the technology environment surrounding modern process improvement, Tech Certification can complement DMAIC knowledge with broader technology-focused learning.
FAQs
1. What is a real-world Six Sigma DMAIC example?
A practical Six Sigma DMAIC example could involve a manufacturer experiencing an excessive defect rate in a packaging process.
Suppose the company currently has a 7.2% packaging defect rate, while its customer requirement is below 2%. Defects create rework, scrap, delayed shipments, and customer complaints.
The project follows:
Define → Measure → Analyze → Improve → Control
The objective is not simply to “improve packaging.” It is to identify what causes the measurable performance gap, implement evidence-based solutions, and ensure the gains remain after the project closes.
2. What is the problem statement for this DMAIC example?
A strong DMAIC problem statement describes the current performance problem without assuming its cause or prescribing a solution.
For this example:
“During the past six months, the packaging line averaged a 7.2% defect rate compared with the customer requirement of less than 2%. Packaging defects have increased rework, material waste, and customer complaints.”
A weak statement would be:
“Operators need better training.”
That already assumes the cause and solution. DMAIC would become an elaborate exercise in proving something management decided before collecting evidence, a surprisingly durable corporate tradition.
3. What is the goal statement for the DMAIC project?
The goal statement should be specific, measurable, achievable, relevant, and time-bound.
For example:
“Reduce the packaging defect rate from 7.2% to below 2.0% within five months while maintaining production throughput and meeting customer requirements.”
The goal contains a clear baseline and target:
Baseline = 7.2%
Target < 2.0%
This gives the team an objective measure for determining whether the project succeeds.
4. What should the DMAIC project charter include?
The project charter formally establishes the improvement initiative.
For this packaging example, the charter could define the business case as reducing quality losses and customer complaints. The scope might begin when finished products enter the packaging line and end when packaged units are released for shipment.
The primary metric would be packaging defect rate, while secondary metrics might include rework cost, scrap cost, throughput, and customer complaints.
The charter would also identify the Champion, project leader, process owner, team members, project milestones, expected financial benefit, and important constraints.
5. How would SIPOC be used in this DMAIC example?
A SIPOC provides a high-level picture of the packaging process.
Suppliers could include production, packaging-material suppliers, maintenance, and scheduling.
Inputs could include finished products, cartons, labels, sealing material, equipment settings, and production orders.
The Process could be summarized as:
Receive Product → Pack → Seal → Label → Inspect → Release
Outputs would include packaged products, inspection records, and rejected units.
Customers could include distribution, retailers, and end consumers.
This establishes process boundaries before the team begins detailed measurement.
6. What happens during the Measure phase in this example?
During Measure, the team determines exactly how packaging defects are defined and measured.
An operational definition might classify a unit as defective if it contains at least one specified packaging failure, such as an incomplete seal, incorrect label, damaged carton, or missing component.
The team then validates the inspection method, creates a data collection plan, and collects baseline information by defect type, machine, shift, product, material lot, operator, and time period.
This creates reliable data for determining where the 7.2% defect rate actually comes from.
7. How is baseline performance calculated?
Suppose the team inspects 50,000 packaged units during the baseline period and identifies 3,600 defective units.
The defective rate is:
Defective Rate = 3,600 ÷ 50,000 × 100
Defective Rate = 7.2%
This confirms the baseline established in the project charter.
If each unit has multiple defect opportunities, the team could also calculate DPMO, but the operational definition of opportunities must be established consistently before doing so.
Numbers are cooperative creatures until people change their definitions halfway through the project.
8. How can a Pareto chart be used in the Analyze phase?
Suppose the team categorizes the 3,600 defective units and finds:
Defect Type | Defects | Percentage |
|---|---|---|
Seal failure | 1,800 | 50% |
Incorrect label | 900 | 25% |
Carton damage | 540 | 15% |
Missing insert | 216 | 6% |
Other | 144 | 4% |
The first two categories account for 75% of recorded defects.
The team can therefore prioritize seal failures and incorrect labels for deeper root cause investigation rather than attacking every defect category simultaneously.
9. How would a Fishbone Diagram support this DMAIC project?
For seal failures, the team could create a Fishbone Diagram using categories such as People, Machine, Method, Material, Measurement, and Environment.
Potential causes might include incorrect sealing temperature, worn sealing components, inconsistent packaging material, machine speed, setup variation, inadequate inspection, or environmental conditions.
These branches are potential causes, not proven causes.
The Fishbone Diagram organizes the investigation. The team must still determine which factors actually influence seal performance.
10. How could the 5 Whys be used in this example?
Suppose data shows that seal failures frequently occur after product changeovers.
The team could investigate:
Why are seals failing after changeovers?
Because sealing temperature is sometimes outside the required range.
Why is temperature outside the range?
Because the machine is manually reset during changeover.
Why are incorrect values entered?
Because operators reference different setup sheets.
Why are different sheets available?
Because obsolete versions remain at several workstations.
The investigation suggests a potential system cause involving setup-document control and parameter standardization.
The team should then verify this relationship with actual process data.
11. How are suspected root causes statistically validated?
Suppose the team suspects that sealing temperature, machine speed, and packaging-material supplier affect seal defects.
It can collect data for each factor and use appropriate methods such as regression, hypothesis testing, ANOVA, or designed experiments.
Imagine analysis shows that seal failures increase significantly when temperature falls below the validated operating range, while machine speed has little effect within normal settings.
The team now has evidence supporting temperature control as a critical factor.
This distinction matters:
Brainstormed Cause → Hypothesis
Data-Supported Cause → Validated Driver
A cause does not become real because six people nodded at it during a meeting.
12. What root causes might the DMAIC project identify?
Assume the analysis validates three important causes.
First, sealing-temperature settings vary after changeovers because setup instructions are inconsistent.
Second, worn sealing components are not replaced consistently because preventive-maintenance intervals are poorly defined.
Third, incorrect labels occur because operators can manually select visually similar label files.
These findings provide a much stronger basis for improvement than the original possibility of simply “retraining operators.”
The validated causes point toward weaknesses in standardization, maintenance, and error prevention.
13. What improvements could be implemented?
The team could implement standardized digital setup parameters for the sealing equipment, remove obsolete instructions, and introduce automatic parameter verification after changeovers.
Preventive-maintenance intervals could be revised based on equipment performance, with replacement criteria established for critical sealing components.
For labeling, the production order could automatically select the correct label file, with barcode verification preventing mismatched labels from being released.
Each solution directly addresses a validated root cause rather than adding another layer of inspection around the existing failure.
14. Why should the improvements be piloted?
A pilot allows the team to test the proposed changes before full-scale implementation.
Suppose the improvements are implemented on one packaging line for four weeks.
The team monitors defect rate, throughput, downtime, changeover time, and any unintended consequences.
If the pilot reduces defects but doubles changeover time, the solution needs further refinement.
A pilot answers the inconvenient but necessary question:
“Does this solution actually work under real operating conditions?”
PowerPoint, tragically, is not considered an operating condition.
15. How can the team verify the DMAIC improvement?
Suppose the pilot processes 20,000 units and produces 260 defective units.
The new defect rate is:
260 ÷ 20,000 × 100 = 1.3%
The project has therefore moved from:
Baseline = 7.2%
to:
Post-Improvement = 1.3%
This exceeds the target of less than 2%.
The team should also use appropriate statistical analysis to determine whether the improvement is significant and examine whether the process remains stable over time.
16. How can the financial benefit of the DMAIC project be calculated?
Suppose the plant produces 1,000,000 units annually.
At the original 7.2% defect rate:
72,000 defective units per year
At the improved 1.3% rate:
13,000 defective units per year
That represents approximately:
59,000 fewer defective units annually
If each defect costs an average of $8 in material, labor, and rework, estimated annual avoided cost is:
59,000 × $8 = $472,000
Finance should validate the assumptions and determine how much qualifies as hard savings, cost avoidance, or another benefit category.
17. What happens during the Control phase in this example?
During Control, responsibility for maintaining the improved process shifts from the project team to normal operations.
The team standardizes setup instructions, updates preventive-maintenance procedures, trains relevant employees, establishes process monitoring, documents reaction procedures, and assigns clear ownership.
Important variables such as sealing temperature and defect rate can be monitored over time.
The goal is to ensure the process does not gradually migrate back toward the original 7.2% defect rate after everyone stops attending DMAIC meetings.
18. What would a Control Plan look like for this project?
A simplified Control Plan might contain:
Characteristic | Requirement | Method | Frequency | Owner | Reaction |
|---|---|---|---|---|---|
Sealing temperature | Validated operating range | Machine sensor | Continuous | Operator | Stop and correct |
Seal defects | < 2% | Inspection/SPC | Hourly | Quality | Investigate signal |
Label accuracy | ≥ 99.9% | Barcode verification | Every unit | System/Operator | Hold affected units |
Sealing components | Defined condition | Maintenance inspection | Scheduled | Maintenance | Replace if limit exceeded |
The actual Control Plan should define precise limits, methods, responsibilities, records, and escalation procedures appropriate to the process.
19. How would a control chart help sustain the improvement?
A control chart can monitor process performance over time and distinguish common-cause variation from potential special-cause signals.
For example, the team might monitor the proportion of defective packages using an appropriate attribute control chart.
If the process remains stable around the improved level, operations can continue under normal controls.
If a statistically meaningful signal appears, the reaction plan should trigger investigation.
The team should not confuse control limits with the customer specification of less than 2%. Control limits describe process behavior, while specifications describe required performance.
20. What does the complete DMAIC example look like from problem statement to Control Plan?
The entire project can be summarized as:
DEFINE
Packaging defect rate averages 7.2%, compared with a customer requirement below 2%.
↓
MEASURE
The team establishes operational definitions, validates inspection, collects representative data, and confirms the 7.2% baseline.
↓
ANALYZE
Pareto analysis identifies seal failures and incorrect labels as major contributors. Fishbone analysis and 5 Whys generate potential causes. Data analysis validates inconsistent sealing parameters, inadequate maintenance controls, and manual label selection as important drivers.
↓
IMPROVE
The team standardizes machine parameters, strengthens preventive maintenance, introduces automatic setup verification, and implements barcode-based label controls.
↓
VERIFY RESULTS
Pilot defect rate falls to 1.3%, while throughput remains acceptable.
↓
FINANCIAL IMPACT
Approximately 59,000 defects per year are avoided, representing an estimated $472,000 annual benefit before finance validation.
↓
CONTROL
The team establishes standard work, ownership, monitoring, preventive-maintenance requirements, control charts where appropriate, and a documented reaction plan.
The logic connecting the project is:
Problem Statement → Baseline → Potential Causes → Validated Root Causes → Targeted Solutions → Verified Results → Control Plan
That chain is the real value of DMAIC.
A weak improvement project often jumps from:
“Defects are high” → “Train the operators.”
A disciplined DMAIC project asks:
How high are defects? Which defects dominate? Where and when do they occur? What variables explain them? Which causes are supported by evidence? What solution addresses those causes? Did the solution actually work? How will we prevent performance from deteriorating again?
That is a considerably longer route than guessing.
It is also why the process is less likely to end six months later with another training session, another defect spike, and a meeting devoted to discovering why the previous meeting failed.
Related Articles
View All
Six Sigma
Six Sigma vs ISO 9001: Certification, Quality Systems, and Process Control
Compare Six Sigma vs ISO 9001 for certification, QMS governance, DMAIC, audits, and process control. Learn when to use each approach.

Six Sigma
Six Sigma in Procurement: Improving Supplier Quality and Cost Control
Learn how Six Sigma in procurement improves supplier quality, reduces defects, controls cost, and strengthens purchase-to-pay performance with DMAIC.
Six Sigma
Six Sigma in Project Management: Better Scope, Schedule, and Quality Control
Learn how Six Sigma in project management improves scope control, schedule reliability, and quality using DMAIC, CTQs, control charts, and change governance.
Trending Articles
The Role of Blockchain in Ethical AI Development
How blockchain technology is being used to promote transparency and accountability in artificial intelligence systems.
AWS Career Roadmap
A step-by-step guide to building a successful career in Amazon Web Services cloud computing.
Top 5 DeFi Platforms
Explore the leading decentralized finance platforms and what makes each one unique in the evolving DeFi landscape.