

Six Sigma Flowcharts Explained: Mapping Steps, Decisions, and Handoffs
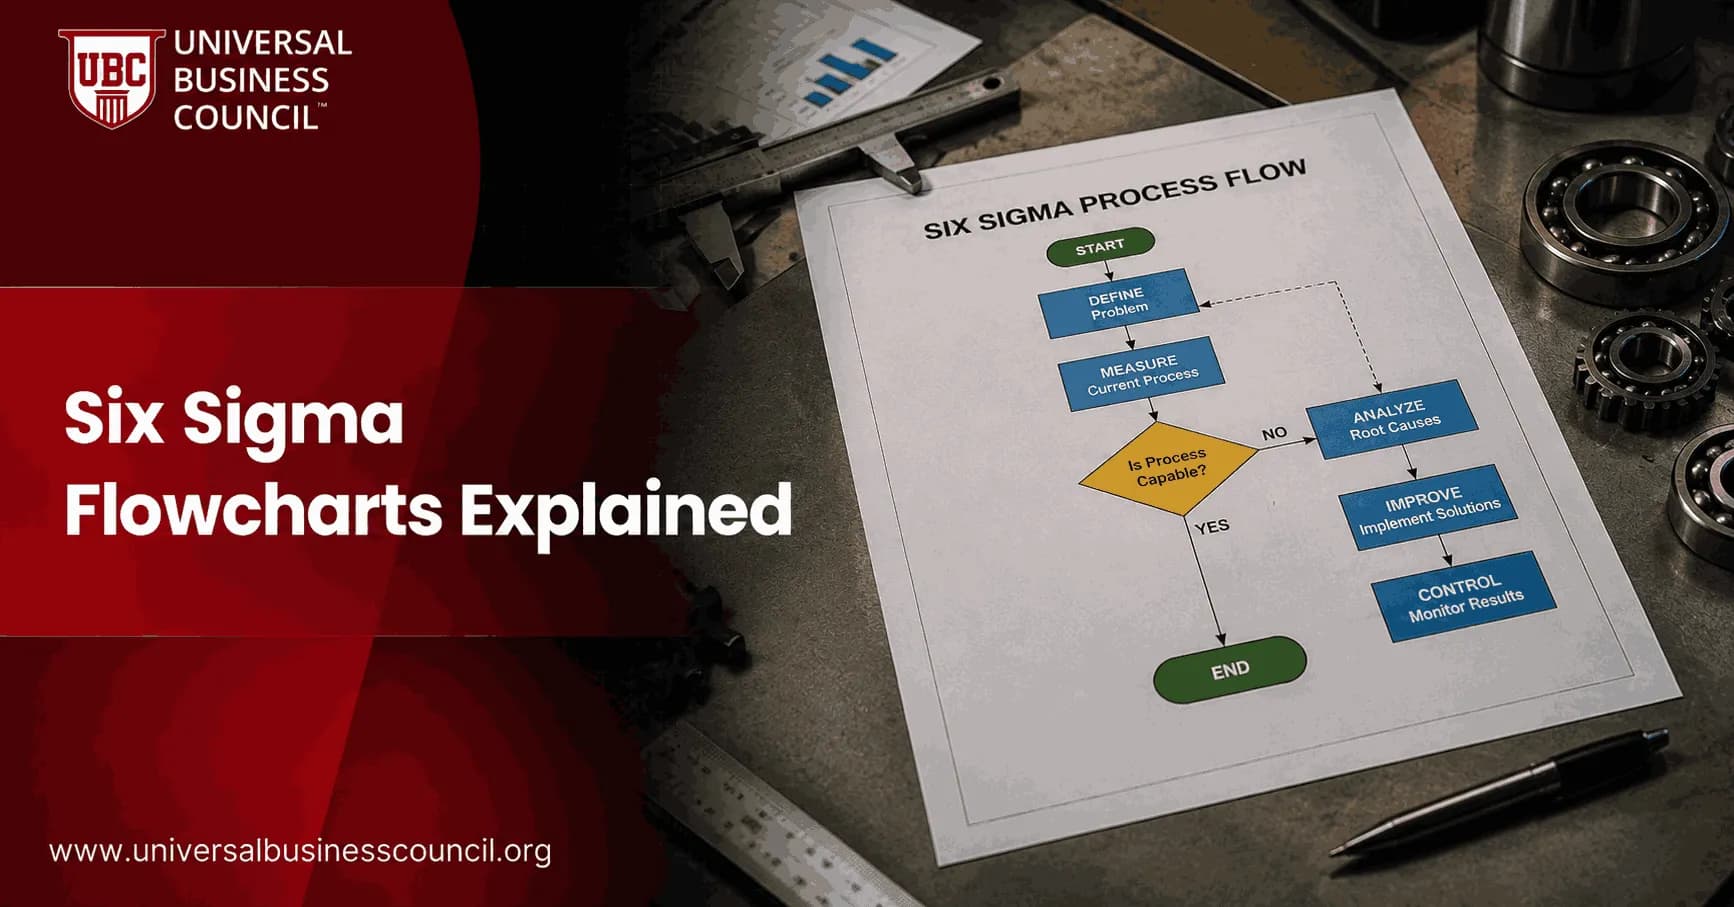
Six Sigma flowcharts turn a process from hearsay into something a team can inspect. They show the work steps, decision points, waits, rework loops, and handoffs that sit inside a real process, not the tidy version written in a procedure manual. Professionals building this discipline often start with a focused credential like the Certified Six Sigma Expert program, since a flowchart only becomes useful once you know how to turn it into a measured, DMAIC-driven improvement project.
That distinction matters. In DMAIC projects, a flowchart is often the first artifact that exposes where defects, delays, and ownership gaps actually begin. I once mapped a purchase approval process where the task work took less than 20 minutes, but the request sat in three different approval queues for almost five business days. The problem was not effort. It was flow.

What Are Six Sigma Flowcharts?
A Six Sigma flowchart is a visual map of how work moves from a defined starting point to a final output. It uses standard symbols so people from operations, quality, finance, IT, and leadership can read the same process in the same way.
In Six Sigma process mapping, flowcharts usually sit between a high-level SIPOC diagram and a detailed work instruction. SIPOC clarifies suppliers, inputs, process, outputs, and customers. A flowchart then shows the actual path work follows, including decisions and exceptions.
Common Flowchart Symbols
Oval: Start or end of the process.
Rectangle: A process step or activity.
Diamond: A decision point, such as approved or rejected.
Arrow: Direction of flow.
Document symbol: A form, record, report, or file.
Delay symbol: A waiting point, queue, or hold.
Consistent symbols matter because the map has to be readable by a cross-functional team, not just the person who drew it. If your finance lead has to ask what a shape means, the diagram has already failed part of its job. Getting operations, quality, finance, and IT to actually sit in the same room and agree on what the map shows is a facilitation skill as much as a diagramming one, which is why process leads often pair Six Sigma training with broader Management Certifications, covering the cross-functional facilitation and stakeholder alignment habits that keep a mapping workshop productive.
Where Flowcharts Fit in DMAIC
Six Sigma flowcharts are most useful in the Define, Measure, and Analyze phases of DMAIC.
Define: Set the process boundaries, trigger, output, customer, and business problem.
Measure: Add cycle time, wait time, defect rate, volume, or rework data to the map.
Analyze: Find bottlenecks, decision delays, duplicate checks, and unclear ownership.
Do not rush to statistical testing before the map is trusted. Bad maps create bad measures. Watch the work, ask the people doing it, and compare the map with actual system records in tools such as Salesforce, ServiceNow, HubSpot, ERP systems, or Google Sheets. The gemba principle still applies in office work: go where the work happens.
Three Types of Six Sigma Flowcharts
1. Standard Process Flowchart
This is the basic version. It works well for simple workflows with a clear sequence, such as invoice entry, order picking, or customer refund processing.
Use it when you need shared understanding fast. Do not use it as your final analysis tool if multiple teams, systems, or approval groups touch the process.
2. Swimlane or Deployment Flowchart
A swimlane flowchart separates steps by role, department, location, or system. This is the better choice when handoffs are the suspected source of delay.
To be blunt, many improvement teams over-focus on task time. Handoffs are often worse. A claims team may process a form in seven minutes, then wait two days for a missing customer document because nobody owns the follow-up.
3. Detailed Alternate-Path Flowchart
This map shows exceptions, branches, rework loops, and special cases. It helps when defect handling is messy or when people disagree about what happens after a failed check.
Use this type after you understand the main process. Starting with too much detail can bury the team in boxes and arrows before the key problem is clear.
How to Map Steps, Decisions, and Handoffs
Define the boundaries. Name the trigger that starts the process and the output that ends it. Keep the scope narrow enough to finish in one or two working sessions.
List the real steps. Ask operators, analysts, supervisors, and system users what actually happens. Include workarounds. Especially include rework.
Draw the main flow. Use rectangles for activities and arrows for sequence. Keep each process box action-oriented, such as verify address or inspect returned item.
Add decisions. Use diamonds for questions with clear outcomes. Label each branch, such as yes, no, pass, fail, complete, or incomplete.
Show handoffs. If another person, team, system, or supplier takes over, make that visible. In a swimlane map, every lane change is a potential delay point.
Validate the map. Review it with people who do the work. Then test it against recent cases, tickets, orders, forms, or production records.
Add data last. Once the flow is accurate, attach cycle time, wait time, defect rate, batch size, uptime, or changeover time where relevant.
What Data Should You Add to a Flowchart?
A good Six Sigma process map should not stay as a pretty diagram. Add performance data so the team can separate opinion from evidence.
Cycle time per step: Shows where active work consumes time.
Wait time: Reveals queues, approval delays, and idle work.
Defect rate: Identifies where errors enter the process.
Rework frequency: Shows how often work loops backward.
Owner: Clarifies accountability for each step.
Control point: Marks approvals, checks, audits, or error-proofing steps.
For production or logistics, connect the flowchart to value stream mapping, which tracks process time, lead time, inventory, batch size, and information flow. The simple ratio to watch is processing time divided by total lead time. If a process takes 30 minutes of work across a 10-day lead time, your biggest opportunity is probably waiting, not worker speed. When that waiting traces back to systems such as Salesforce, ServiceNow, or an ERP that will not share status data across the handoff, a Deep Tech Certification from Blockchain Council can help teams understand how integrated, traceable systems close that gap, since a flowchart's wait-time data is only as accurate as the systems recording it.
Common Mistakes to Avoid
Mapping the policy, not the work: Procedures often skip the workaround that everyone uses.
Leaving decisions vague: A diamond labeled review is not a decision. Ask what question is being answered.
Ignoring handoffs: Every transfer creates risk, especially when no owner is named.
Adding data too early: Measure after the team agrees the map reflects reality.
Stopping at the diagram: The point is improvement, not documentation.
How Professionals Can Build This Skill
If you manage processes, lead quality projects, or work in operations, Six Sigma flowcharts are a practical skill worth formal study. Universal Business Council certification and training pathways in Six Sigma, Lean management, project management, and operations management give readers a structured route from process mapping through to full DMAIC execution.
Start with one process this week. Choose something small: refund approval, purchase requisition, onboarding, ticket escalation, sample inspection, or month-end reporting. Map the current state with the people who do the work. Mark every decision and handoff. Then add wait time. You will usually find the first improvement target before the meeting ends. If your wait-time data keeps looking unreliable because it lives across systems that will not share status cleanly, a Tech Certification from Global Tech Council is worth adding to your plan, since some mapping problems need better systems integration, not another workshop.
FAQs
1. What is a Six Sigma flowchart?
A Six Sigma flowchart is a visual representation of the steps, decisions, inputs, outputs, and handoffs within a process. It shows how work actually moves from beginning to end and helps teams identify delays, duplication, bottlenecks, unnecessary approvals, rework, and potential failure points.
A simple process might look like:
Receive Order → Validate Order → Process Payment → Ship Product → Confirm Delivery
In Six Sigma, flowcharts turn an invisible process into something a team can examine systematically. This is useful because processes described verbally have an uncanny tendency to sound much cleaner than processes observed in reality.
2. Why are flowcharts important in Six Sigma?
Flowcharts help Six Sigma teams develop a shared understanding of how a process operates before attempting to improve it.
They can reveal:
Unnecessary steps
Repeated work
Bottlenecks
Waiting
Rework loops
Excessive approvals
Poorly defined responsibilities
Complex handoffs
Missing controls
A flowchart therefore provides a foundation for data collection, root cause analysis, waste reduction, and process redesign.
3. When are flowcharts used in DMAIC?
Flowcharts can support every stage of DMAIC:
Define: Establish process boundaries and scope.
Measure: Identify where data should be collected.
Analyze: Locate bottlenecks, rework, and potential causes.
Improve: Design a simpler future-state process.
Control: Standardize the improved workflow and identify monitoring points.
They are particularly valuable early in a project because analyzing a process nobody has clearly defined is an ambitious statistical hobby.
4. What are the basic symbols used in a Six Sigma flowchart?
Common flowchart symbols include:
Oval: Start or end point.
Rectangle: Process step or activity.
Diamond: Decision point.
Arrow: Direction of process flow.
Parallelogram: Input or output.
Connector: Link between different sections of a flowchart.
Organizations may use additional symbols, but consistency matters more than decorative complexity. A process map should make the workflow easier to understand, not require a separate degree in process-map archaeology.
5. How do you create a Six Sigma flowchart?
A practical approach is:
Step 1: Define the process start and end points.
Step 2: Identify the major activities.
Step 3: Arrange activities in actual sequence.
Step 4: Add decision points.
Step 5: Map alternative paths and rework loops.
Step 6: Identify handoffs between people or departments.
Step 7: Validate the flowchart with people performing the work.
Step 8: Observe the real process where possible.
Step 9: Correct the map based on evidence.
Step 10: Analyze it for improvement opportunities.
The objective is to map reality, not the process executives vaguely remember approving four years ago.
6. What is a decision point in a Six Sigma flowchart?
A decision point represents a condition that determines which path the process follows. It is normally shown using a diamond.
For example:
Application Complete?
Yes → Approve for processing
No → Return for missing information
Decision points are particularly important because they can create branching, delays, rework, inconsistent outcomes, and additional handoffs.
Teams should clearly define the criteria behind important decisions rather than leaving them dependent on individual interpretation.
7. What is a process handoff in Six Sigma?
A handoff occurs when responsibility, information, material, or work transfers from one person, department, system, or organization to another.
For example:
Sales → Finance → Operations → Logistics → Customer
Every handoff can introduce risks such as:
Waiting
Lost information
Data-entry errors
Miscommunication
Duplicate work
Unclear ownership
Processes with excessive handoffs often have longer lead times and greater opportunities for defects.
8. How do flowcharts help identify bottlenecks?
A bottleneck is a step whose limited capacity constrains overall process flow.
Flowcharts help teams locate areas where:
Work arrives → Queue develops → Processing occurs slowly → Downstream work waits
Examples include approval stages, inspection stations, specialized machines, or overloaded employees.
After identifying a suspected bottleneck, Six Sigma teams should confirm it with data such as queue time, utilization, cycle time, work-in-process, or throughput.
The diagram suggests where to investigate. It does not grant the rectangle statistical authority.
9. How do flowcharts help identify waste?
Flowcharts make non-value-added activities easier to see.
Teams can examine each step and ask:
Does the customer value this activity?
Is it required for the product or service?
Could it be eliminated, combined, simplified, or automated?
Typical waste visible in flowcharts includes:
Waiting → Transportation → Motion → Overprocessing → Rework → Unnecessary approvals
When combined with Lean methods, process mapping becomes particularly useful for eliminating waste.
10. What is the difference between a flowchart and a process map?
The terms are sometimes used interchangeably, but a flowchart usually focuses on the sequence and logic of activities, while a broader process map may include additional information such as responsibilities, inputs, outputs, cycle times, risks, or performance measures.
A flowchart might show:
Receive → Check → Approve → Process
A detailed process map might also show:
Who performs each step + time required + systems used + defects + handoffs
The appropriate level of detail depends on the improvement question.
11. What is a cross-functional flowchart?
A cross-functional flowchart, often called a swimlane diagram, organizes process activities according to the people, departments, functions, or systems responsible for them.
For example:
Customer | Sales | Finance | Operations | Logistics
Each process step is placed in the appropriate lane.
Whenever the process crosses from one lane to another, a handoff occurs.
Swimlane diagrams are particularly effective for exposing processes where a simple customer request takes an unexpected sightseeing tour through seven departments.
12. What is the difference between a flowchart and SIPOC?
A SIPOC diagram provides a high-level view of:
Suppliers → Inputs → Process → Outputs → Customers
A flowchart provides a more detailed view of the steps and decisions inside the process.
For example:
SIPOC: Provides the overall boundaries and relationships.
Flowchart: Shows exactly how work moves through those boundaries.
A common Six Sigma approach is:
SIPOC → High-Level Process Map → Detailed Flowchart
This allows teams to add detail gradually rather than mapping the entire corporate civilization on day one.
13. What is an as-is flowchart in Six Sigma?
An as-is flowchart, or current-state flowchart, documents how the process actually operates today.
It should include:
Real process steps
Actual decisions
Existing approvals
Workarounds
Rework loops
Waiting points
Handoffs
The purpose is not to show how the SOP says the process should work.
Understanding the current state is essential because improvement requires knowing what is genuinely happening before designing what should happen instead.
14. What is a future-state flowchart?
A future-state flowchart shows how the process should operate after improvements are implemented.
Teams may redesign the current process by:
Removing unnecessary steps
Combining activities
Reducing approvals
Automating repetitive work
Eliminating rework
Simplifying decisions
Reducing handoffs
Moving controls closer to the source
The comparison becomes:
Current State → Identify Waste and Causes → Redesign → Future State
The future-state map should represent a feasible improved process, not an optimistic drawing in which queues have vanished because nobody drew them.
15. How can flowcharts support root cause analysis?
Flowcharts help teams understand where problems occur and what happens immediately before them.
Suppose defects appear after an approval step. The team can examine:
Inputs → Processing → Decision → Handoff → Failure
The map can then support tools such as:
5 Whys
Fishbone diagrams
Pareto analysis
FMEA
Data stratification
Hypothesis testing
A flowchart does not prove root cause, but it provides structure for identifying where evidence should be collected.
16. How can Six Sigma flowcharts reduce cycle time?
Flowcharts help separate processing time from waiting time.
Consider:
Receive Request → Wait 2 Days → Review 20 Minutes → Wait 1 Day → Approve 10 Minutes
The actual work requires only 30 minutes, while total lead time exceeds three days.
This exposes opportunities to reduce queues, batch processing, approval delays, and unnecessary handoffs.
In many service processes, the work itself is surprisingly fast. The process simply spends most of its existence waiting politely in somebody's inbox.
17. How do you identify value-added and non-value-added steps on a flowchart?
A value-added activity generally transforms the product or service in a way the customer values and is performed correctly the first time.
A non-value-added activity consumes resources without directly creating customer value.
Examples may include:
Value-added: Manufacturing, configuration, diagnosis, service delivery.
Non-value-added: Waiting, duplicate data entry, unnecessary transportation, rework.
Some activities are necessary but non-value-added, such as certain regulatory controls.
Teams should therefore distinguish:
Value-Added (VA)
Business-Necessary Non-Value-Added (BNVA)
Non-Value-Added (NVA)
This prevents people from enthusiastically deleting compliance requirements because a colored sticky note called them waste.
18. What is an example of a Six Sigma flowchart?
Consider a customer returns process:
Start
↓
Customer Submits Return
↓
Return Information Complete?
↙ No → Request Missing Information → Recheck
↘ Yes
↓
Validate Purchase
↓
Return Eligible?
↙ No → Notify Customer → End
↘ Yes
↓
Approve Return
↓
Receive Product
↓
Inspect Product
↓
Issue Refund
↓
End
The map immediately exposes decision points, a potential rework loop, handoffs, and locations where cycle-time or defect data could be collected.
19. What are common mistakes when creating Six Sigma flowcharts?
Common mistakes include:
Mapping the documented process instead of the real process.
Adding too much detail too early.
Ignoring rework loops and exceptions.
Leaving out decision criteria.
Failing to show handoffs.
Creating the map without frontline employees.
Assuming the flowchart proves root cause.
Never updating the map after process changes.
The most dangerous flowchart is often the beautifully formatted one everyone agrees is inaccurate but nobody wishes to offend.
A useful process map should be treated as an analytical tool, not wall decoration.
20. How do Six Sigma flowcharts improve process performance?
Six Sigma flowcharts improve performance by making the structure of work visible.
A useful improvement sequence is:
Define Process Scope
↓
Map Current State
↓
Identify Steps and Decisions
↓
Highlight Handoffs
↓
Measure Cycle Time and Waiting
↓
Identify Rework and Waste
↓
Analyze Root Causes
↓
Remove or Simplify Non-Value-Added Work
↓
Design Future State
↓
Implement Changes
↓
Standardize and Control the New Process
The greatest value comes from combining the visual map with actual process data.
For example:
Process Step | Processing Time | Waiting Time | Defect Rate |
|---|---|---|---|
Receive request | 5 min | 2 hrs | 1% |
Validate data | 10 min | 6 hrs | 8% |
Manager approval | 5 min | 18 hrs | 1% |
Complete request | 20 min | 3 hrs | 2% |
The flowchart shows where the work goes. The measurements show where the performance problem actually is.
Together, they allow Six Sigma teams to answer the questions that matter:
Where does work wait?
Where do defects enter?
Which decisions create rework?
Which handoffs create delays?
Which activities add no customer value?
What can be eliminated, simplified, combined, standardized, or automated?
That is why flowcharts remain useful despite their apparent simplicity. They force an organization to confront the awkward difference between how management thinks work happens and how work actually happens.
Related Articles
View AllSix Sigma
Six Sigma Hypothesis Testing Explained: Validating Improvement Decisions
Learn how Six Sigma hypothesis testing validates root causes, pilot results, and control decisions using p values, effect sizes, and confidence intervals.
Six Sigma
Six Sigma Minitab Explained: Statistical Software for DMAIC Projects
Learn how Six Sigma Minitab supports DMAIC projects with capability analysis, control charts, DOE, regression, Minitab Engage, and real project results.

Six Sigma
Six Sigma and Business Intelligence: Better Reporting for Better Decisions
Learn how Six Sigma and Business Intelligence improve CTQ metrics, dashboards, data quality, predictive reporting, and enterprise decisions.
Trending Articles
The Role of Blockchain in Ethical AI Development
How blockchain technology is being used to promote transparency and accountability in artificial intelligence systems.
AWS Career Roadmap
A step-by-step guide to building a successful career in Amazon Web Services cloud computing.
Top 5 DeFi Platforms
Explore the leading decentralized finance platforms and what makes each one unique in the evolving DeFi landscape.