

Six Sigma Value Stream Mapping: Find Waste and Bottlenecks
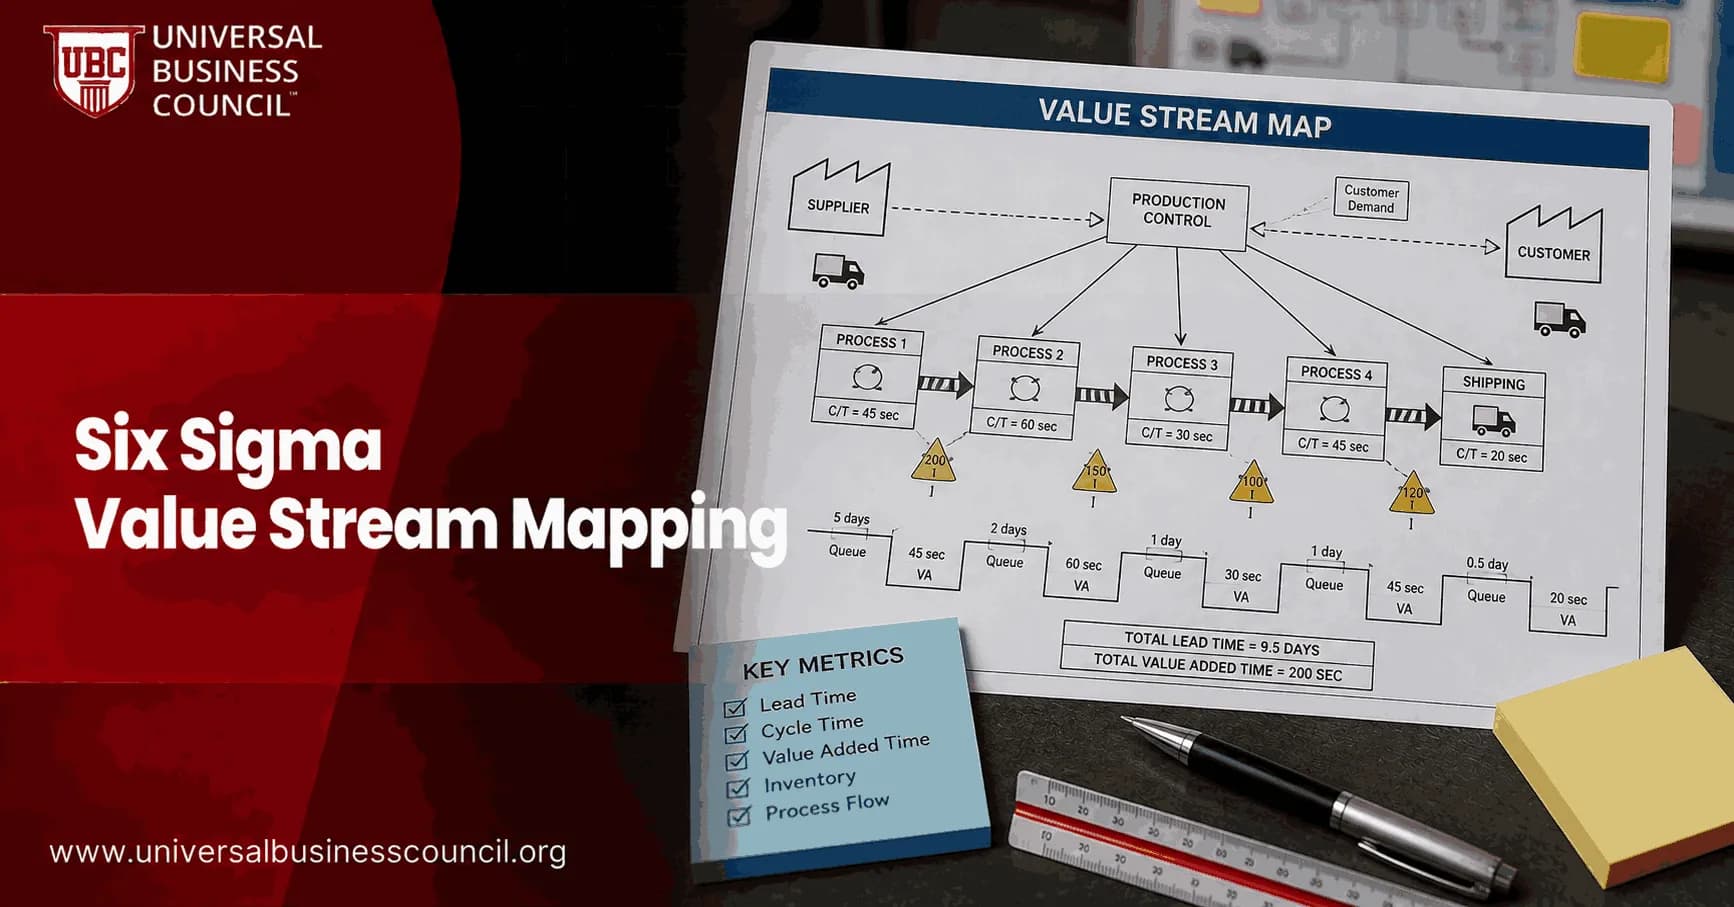
Six Sigma value stream mapping gives you a practical way to see where work slows down, where defects enter the process, and where time is lost without adding value for the customer. The point is not to draw a neat process chart. The point is to expose the truth of the flow. For professionals developing structured process improvement skills, a Certified Six Sigma Expert pathway can provide a practical foundation for applying VSM alongside DMAIC, measurement, and root cause analysis.
Used inside Lean Six Sigma, value stream mapping, or VSM, connects visual process mapping with DMAIC discipline: Define, Measure, Analyze, Improve, and Control. Lean shows waste. Six Sigma adds measurement, variation analysis, and defect thinking. Together, they stop teams from guessing.

What Six Sigma Value Stream Mapping Actually Shows
A value stream map tracks the movement of materials, information, decisions, and work items from customer request to delivery. In a factory, that may mean raw material to finished goods. In a service business, it may mean quote request to signed contract, claim submission to payment, or support ticket to resolution.
For professionals who want to connect process improvement with broader organizational and leadership capabilities, Management Certifications can complement this learning by developing skills useful for coordinating teams, managing workflows, and sustaining improvement initiatives.
The useful part is the timeline. You separate value added time from waiting, handoffs, rework, queues, approvals, and storage. Many teams get an uncomfortable surprise here. In a lot of real processes, value added time works out to a small fraction of total lead time, sometimes only a few percent. That means the customer waits through a process that is mostly idle.
That is not rare. It is normal. And it is fixable.
Where VSM Fits in DMAIC
Six Sigma value stream mapping works best when it is not treated as a one-off workshop poster. Place it inside DMAIC and it becomes a measurement tool.
Define: Choose the product family, service pathway, or process boundary. Be specific. Do not map the whole company.
Measure: Walk the actual process and capture cycle time, queue time, changeover time, uptime, batch size, defects, and rework.
Analyze: Mark bottlenecks, waste, variation, and defect clusters directly on the current state map.
Improve: Design a future state map with better flow, smaller queues, fewer handoffs, and clearer information signals.
Control: Track lead time, first pass yield, work in process, and defect rates so the process does not drift back.
Lean Six Sigma teaching stresses the same habit: walk the process, collect time and quality data at each step, then use the map to find what blocks flow. Desk mapping from a conference room misses too much.
The Eight Wastes VSM Helps You Find
Lean's eight wastes are easy to recite and hard to see in daily work. A current state value stream map makes them visible.
Defects: Rework, scrap, corrections, failed inspections, duplicate data entry.
Overproduction: Making or processing more than the next step can use.
Waiting: Jobs sitting in queues, approvals stuck in inboxes, machines idle for material.
Non utilized talent: Operators, analysts, or service staff building workarounds instead of improving the system.
Transportation: Unnecessary movement of parts, files, tickets, or information.
Inventory: Excess work in process, unfinished cases, open tickets, or stored goods.
Motion: People walking, searching, switching screens, or chasing status updates.
Extra processing: Checks, reports, approvals, or features the customer does not value.
In service processes, the big three are often defects, waiting, and inventory of unfinished work. You see it in claims backlogs, finance approvals, software queues, and customer onboarding. The waste is not always physical, but it still costs money.
How to Detect Bottlenecks Without Guesswork
A bottleneck is the constraint that limits flow. It is not always the person who looks busiest. Sometimes it is an approval rule, a batch policy, or a system field that forces rework.
Look for these patterns
A process step with a much longer cycle time than the steps before and after it.
Large queues before one activity, even when downstream steps sit idle.
High work in process between two stages.
Defect spikes at one station, desk, form, or decision point.
Batching behavior, such as approvals processed only twice per week.
One detail that trips up first-time teams: ERP or workflow tools often record touch time, not wait time. A purchase order might take 12 minutes to approve once opened, but sit in an inbox for three days. If you only measure the 12 minutes, you will improve the wrong thing.
Building a Current State Map That Holds Up
Start narrow. Pick one product family, claim type, order type, or customer journey. Then walk the process with the people who do the work. Bring a stopwatch if you need one. Pull data from systems such as SAP, Salesforce, HubSpot, ServiceNow, Google Analytics 4, or a manufacturing execution system, but verify it on the floor or inside the workflow.
For each step, capture:
Cycle time
Waiting time
Defect rate
First pass yield
Batch size
Available capacity
Changeover or setup time
Information trigger, such as email, kanban, ticket, or order release
Then build the timeline. Put processing time below the steps and waiting time between them. This is where leadership usually pays attention, because the total lead time becomes visible in one line.
Designing the Future State Map
The future state map should not be a wish list. It should answer a harder question: what must change so work flows at the pace customers need?
Good future state actions include:
Reducing batch sizes where queues are caused by grouping work.
Moving quality checks earlier to prevent downstream rework.
Creating pull signals instead of pushing work into overloaded teams.
Balancing cycle times across steps.
Removing approvals that do not reduce risk.
Using standard work for repeatable decisions.
Be blunt about trade-offs. Automation is not always the first move. If the process is poorly designed, automation just makes bad flow faster and harder to correct. Fix the flow first, then digitize what stays stable.
Digital Value Stream Mapping
Newer digital VSM work connects value stream mapping with Industry 4.0 data sources, including sensors, workflow systems, and dashboards. Static maps age quickly. Digital maps can update cycle times, queues, and defect rates closer to real time.
Still, do not skip the walk. Data tells you what happened. Operators and service staff often know why.
Technology-heavy value streams can involve additional causes such as software dependencies, data quality, system latency, automation failures, or integration bottlenecks. Understanding those technical factors can make digital process mapping more useful, particularly for teams working across operations and technology. Deep Tech Certification can provide complementary technology-focused learning for professionals working in these environments.
Skills to Build Next
If you want to apply Six Sigma value stream mapping well, strengthen three areas: Lean waste identification, Six Sigma measurement, and facilitation. The map is only as good as the questions asked in the room.
For structured learning, look for Universal Business Council resources in Six Sigma, Lean process improvement, operations management, and business analytics. Pair VSM practice with DMAIC, root cause analysis, process capability, and control planning.
Your next step is simple: choose one process with visible delays, map the current state this week, and calculate the percentage of value added time. If that number is painful, you have found the right place to start.
As value streams increasingly depend on digital platforms, analytics, automation, and interconnected systems, broader technology knowledge can also help professionals understand the systems behind process constraints. A Tech Certification pathway can complement process improvement expertise with additional technology-focused learning.
FAQs
1. What is Value Stream Mapping in Six Sigma?
Value Stream Mapping (VSM) is a Lean Six Sigma technique used to visualize how materials, information, and work move through a process from beginning to end. It helps teams identify waste, bottlenecks, delays, excessive inventory, rework, and unnecessary process steps.
A typical VSM shows:
Supplier → Process Steps → Customer
along with information such as cycle time, waiting time, inventory, staffing, uptime, and information flows.
Unlike a basic flowchart, VSM focuses heavily on flow and value creation, not merely the sequence of activities.
2. Why is Value Stream Mapping important in Lean Six Sigma?
Value Stream Mapping helps teams see the entire process as a system rather than optimizing individual activities in isolation.
It can reveal:
Excessive waiting
Bottlenecks
High work-in-process
Long lead times
Unnecessary handoffs
Rework loops
Overproduction
Poor information flow
Capacity imbalances
Non-value-added activities
A process can contain efficient individual departments while remaining painfully slow overall. Humans have somehow mastered local optimization while the customer waits at the end.
3. What is the purpose of a Value Stream Map?
The main purpose of a Value Stream Map is to understand how much of total process time actually creates customer value.
For example:
Total Lead Time = 12 days
Value-Added Processing Time = 4 hours
That enormous difference immediately tells the team that most elapsed time is being consumed by waiting, queues, inventory, transportation, approvals, or other non-value-added activities.
VSM helps identify where those losses occur and where improvement effort should be concentrated.
4. When is Value Stream Mapping used in DMAIC?
VSM can support several phases of DMAIC:
Define: Establish process boundaries and understand the overall value stream.
Measure: Document cycle times, queues, inventory, defects, and current performance.
Analyze: Identify bottlenecks, waste, delays, and poor flow.
Improve: Design a future-state value stream.
Control: Establish measures and operating practices to sustain the improved flow.
It is particularly useful when the problem involves lead time, throughput, capacity, inventory, or workflow efficiency.
5. What is a current-state Value Stream Map?
A current-state VSM represents how the process operates today.
It typically documents:
Process steps
Material flow
Information flow
Cycle times
Changeover times
Inventory or queues
Number of operators
Equipment uptime
Defect or yield information
Waiting periods
The objective is to capture reality rather than the beautifully streamlined process described in the procedure manual.
The current-state map establishes the baseline from which improvement opportunities can be identified.
6. What is a future-state Value Stream Map?
A future-state VSM shows how the process should operate after waste and flow problems are addressed.
The future state might include:
Fewer queues
Reduced inventory
Smaller batch sizes
Better process synchronization
Pull systems
Kanban
Improved quality at the source
Reduced changeover time
Better information flow
Balanced workloads
The future-state map should represent an achievable improved system rather than a fantasy process in which every machine has 100% uptime and nothing unexpected ever happens.
7. What information is included in a Value Stream Map?
A detailed VSM may include metrics such as:
Cycle Time (CT): Time required to complete a process activity.
Changeover Time (C/O): Time required to switch between products or activities.
Uptime: Percentage of available operating time.
Work-in-Process (WIP): Items waiting between steps.
Lead Time: Total elapsed time through the value stream.
Yield: Percentage successfully processed.
Operators: Number of people performing the work.
Takt Time: Required production pace based on customer demand.
These metrics help convert the map from a drawing into an analytical tool.
8. What is value-added time in Value Stream Mapping?
Value-added (VA) time is time spent performing activities that transform the product or service in a way the customer values.
A commonly used Lean test asks whether an activity:
Changes the product or service,
Is something the customer values, and
Is performed correctly the first time.
For example, machining a component to its required dimension may be value-added.
Waiting three days for approval generally is not.
VSM makes the contrast between value-added time and total lead time visible.
9. What is non-value-added time in a Value Stream Map?
Non-value-added (NVA) time represents activities or delays that consume resources without directly creating customer value.
Examples include:
Waiting
Rework
Excess transportation
Duplicate data entry
Unnecessary approvals
Excess inventory
Searching for information
Unnecessary movement
Some activities may be business-required but non-value-added, such as certain regulatory or compliance checks.
Teams should distinguish necessary activities from pure waste rather than enthusiastically deleting controls that keep regulators calm.
10. How does Value Stream Mapping identify the 8 wastes?
VSM can help expose the 8 wastes of Lean, commonly remembered as DOWNTIME:
D - Defects: Rework, scrap, corrections.
O - Overproduction: Producing earlier or more than required.
W - Waiting: Idle materials, employees, customers, or information.
N - Non-utilized Talent: Underusing employee knowledge and capability.
T - Transportation: Unnecessary movement of materials or information.
I - Inventory: Excess raw material, WIP, or finished goods.
M - Motion: Unnecessary physical movement.
E - Extra Processing: Work that adds no customer value.
Mapping the full value stream makes these wastes easier to locate and quantify.
11. How does VSM help identify bottlenecks?
A bottleneck is a process step whose capacity limits the throughput of the overall system.
Suppose:
Process A Capacity = 100 units/hour
Process B Capacity = 60 units/hour
Process C Capacity = 90 units/hour
Process B is the likely constraint.
A VSM may show inventory accumulating before Process B and downstream processes occasionally waiting for output.
Teams can then investigate capacity, downtime, cycle time, changeovers, staffing, quality losses, or scheduling at the bottleneck.
12. What is the difference between Value Stream Mapping and process mapping?
A process map primarily shows the sequence of activities and decisions.
A Value Stream Map provides a broader view that usually includes:
Material flow
Information flow
Inventory
Waiting
Cycle times
Lead time
Customer demand
Production control
Therefore:
Process Map → How does the process work?
VSM → How does value flow, where does it wait, and where is waste occurring?
Both are useful, but VSM is especially valuable for end-to-end flow improvement.
13. What is the difference between Value Stream Mapping and SIPOC?
A SIPOC provides a high-level view:
Suppliers → Inputs → Process → Outputs → Customers
A Value Stream Map goes deeper into how work actually flows through the process.
A common progression is:
SIPOC
↓
High-Level Process Map
↓
Current-State VSM
↓
Detailed Analysis
↓
Future-State VSM
SIPOC helps define boundaries. VSM helps identify what happens inside those boundaries and why everything seems to spend so much time waiting.
14. How is takt time used in Value Stream Mapping?
Takt time represents the pace at which the process must produce output to satisfy customer demand.
The basic formula is:
Takt Time = Available Production Time ÷ Customer Demand
Suppose:
Available time = 420 minutes/day
Customer demand = 210 units/day
Then:
Takt Time = 420 ÷ 210 = 2 minutes/unit
The process should therefore produce approximately one unit every two minutes to match demand.
VSM compares process cycle times against takt time to identify potential capacity problems.
15. How are cycle time and lead time different in VSM?
Cycle time measures how long a particular process step takes to perform.
Lead time measures the total elapsed time required for an item to move through the value stream.
For example:
Processing Time = 3 hours
Waiting and Queuing = 5 days
Total Lead Time ≈ 5 days + 3 hours
This distinction is critical because many processes do not spend most of their time being processed. They spend it sitting somewhere, patiently aging.
16. How does inventory affect a Value Stream Map?
Inventory often appears between process steps and can include:
Raw materials
Work-in-process
Finished goods
Transaction backlogs
Unprocessed applications
Email queues
Customer cases
High WIP may indicate:
Overproduction → Capacity imbalance → Large batches → Poor scheduling → Bottlenecks
Inventory can hide process problems while increasing lead time and working-capital requirements.
In service processes, the “inventory” may simply be a queue of unfinished work rather than physical products.
17. Can Value Stream Mapping be used in service processes?
Yes. VSM is widely applicable beyond manufacturing.
For example, a loan application value stream might be:
Application → Initial Review → Credit Check → Underwriting → Approval → Documentation → Funding
The map could measure:
Processing time + waiting time + rework + handoffs + backlog
It might reveal that actual processing requires three hours while the application takes eight days to complete.
Healthcare, banking, insurance, software, logistics, government, and customer service can all use VSM.
18. What are common mistakes when creating a Value Stream Map?
Common VSM mistakes include:
Mapping from conference-room assumptions: The actual process is never observed.
Adding excessive detail: The map becomes unreadable.
Ignoring information flow: Important scheduling and communication problems disappear.
Using estimates instead of measurements: Improvement priorities become questionable.
Mapping too broad a scope: The exercise becomes unmanageable.
Jumping directly to the future state: Current problems are poorly understood.
Optimizing individual steps: Overall flow remains weak.
Creating the map but taking no action: The VSM becomes expensive wall art.
A useful VSM should lead to measurable improvement priorities.
19. What is a practical Value Stream Mapping example?
Consider an order-fulfillment process:
Process | Cycle Time | Waiting Before Step |
|---|---|---|
Order validation | 10 min | 4 hrs |
Credit approval | 15 min | 8 hrs |
Picking | 20 min | 6 hrs |
Packing | 10 min | 2 hrs |
Shipping | 15 min | 12 hrs |
Total processing time:
10 + 15 + 20 + 10 + 15 = 70 minutes
Total waiting time:
4 + 8 + 6 + 2 + 12 = 32 hours
The team should therefore resist obsessing over reducing packing from ten minutes to eight while 32 hours of waiting remain in the process.
VSM makes that prioritization problem rather difficult to ignore.
20. How should Six Sigma teams use Value Stream Mapping to eliminate waste and bottlenecks?
An effective VSM improvement process follows a structured sequence:
Select Product or Service Family
↓
Define Customer Demand
↓
Establish Process Boundaries
↓
Observe the Actual Process
↓
Map Material and Information Flow
↓
Collect Cycle Time, WIP, Yield and Uptime Data
↓
Calculate Lead Time and Value-Added Time
↓
Compare Cycle Times with Takt Time
↓
Identify Bottlenecks
↓
Identify the 8 Wastes
↓
Analyze Root Causes
↓
Design Future-State Map
↓
Prioritize Improvement Actions
↓
Implement Changes
↓
Measure Results
↓
Standardize and Control the New Process
The central question is not merely:
“How long does each activity take?”
It is:
“How does value move from customer request to customer delivery, and what prevents it from flowing smoothly?”
For example:
Current State
Customer Order
↓
Wait
↓
Process
↓
Inventory
↓
Wait
↓
Approval
↓
Rework
↓
Wait
↓
Delivery
can become:
Future State
Customer Demand
↓
Pull Signal
↓
Balanced Process Flow
↓
Built-In Quality
↓
Customer Delivery
The greatest opportunity is often hidden in the difference between touch time and total lead time.
If a process requires 45 minutes of actual work but takes six days to complete, shaving three minutes from an individual task is not where the interesting problem lives.
Value Stream Mapping makes that uncomfortable fact visible, which is precisely why it is useful.
Related Articles
View All
Six Sigma
Six Sigma Certification vs MBA: Cost, ROI, and Career Value
Compare Six Sigma certification vs MBA by cost, ROI, time commitment, salary impact, and career outcomes so you can choose the right path.

Six Sigma
Six Sigma in Automotive: Quality Improvement Across the Value Chain
Learn how Six Sigma in Automotive improves design, manufacturing, supply chain, warranty, and service using DMAIC, Lean, Industry 4.0, and AI analytics.
Six Sigma
Six Sigma in Supply Chain: Improving Reliability and Reducing Waste
Learn how Six Sigma in supply chain improves reliability, cuts inventory errors, reduces damaged goods, and controls waste using DMAIC and Lean Six Sigma tools.
Trending Articles
The Role of Blockchain in Ethical AI Development
How blockchain technology is being used to promote transparency and accountability in artificial intelligence systems.
AWS Career Roadmap
A step-by-step guide to building a successful career in Amazon Web Services cloud computing.
Top 5 DeFi Platforms
Explore the leading decentralized finance platforms and what makes each one unique in the evolving DeFi landscape.