

Six Sigma and Data Analytics: Turning Process Data into Insights
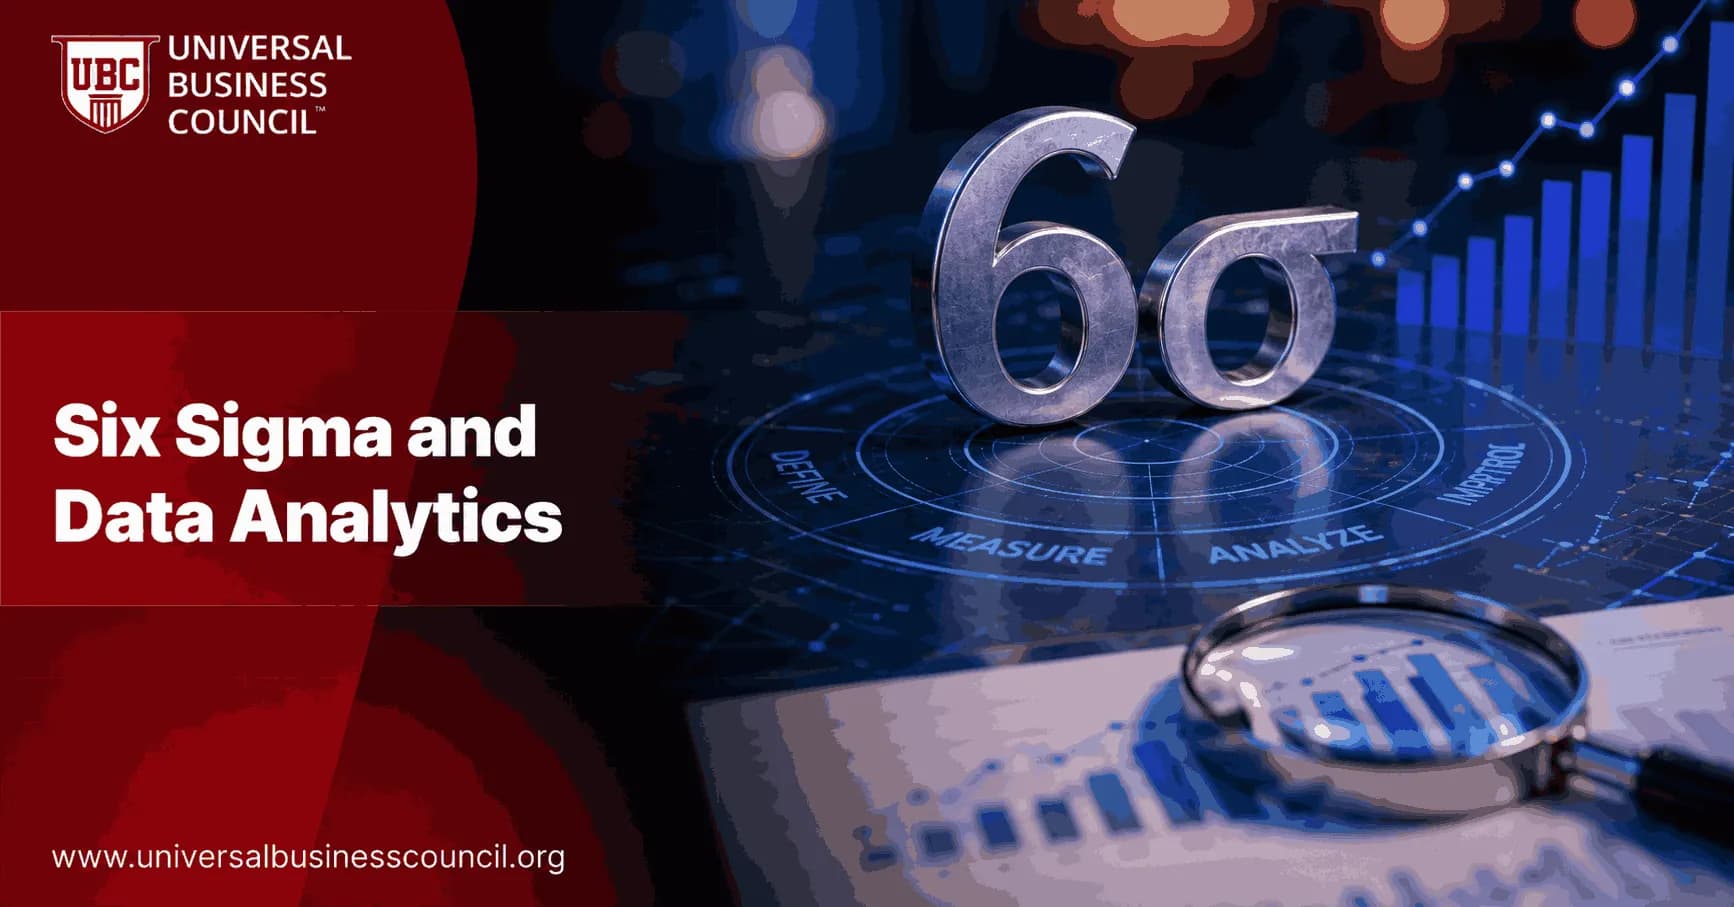
Six Sigma and Data Analytics now sit at the center of serious process improvement work. The old pattern was simple: pull a sample, run a few charts, fix the visible defect. That still has value. It is not enough when your process throws off millions of rows from sensors, CRM events, call logs, claims systems, or product analytics every week. If you are building toward this kind of work, the Certified Six Sigma Expert credential is a solid place to lock in the DMAIC discipline before layering on the analytics side.
The useful shift is not that analytics replaces Six Sigma. It does not. Analytics gives you faster pattern detection. Six Sigma gives you discipline: define the problem, measure it correctly, find causes, improve the process, and keep it stable.

Why Six Sigma Still Matters in a Data-Rich Operation
Six Sigma is still tied to a demanding quality target: 3.4 defects per million opportunities. Few organizations run at that level across every process. The target still forces a hard question: what variation is the customer actually experiencing?
That question is easy to dodge with dashboards. I have watched teams celebrate an average approval time of two days while the 95th percentile sat above nine days. Leadership cared about the average. Customers felt the tail. A basic Six Sigma view exposed the real problem in ten minutes: variation, not central tendency.
Modern data analytics strengthens that work because it can handle larger, messier data sets than project teams could a decade ago. Research on manufacturing firms has found that big data analytics and Six Sigma practices improve perceived quality performance and business performance, with the strongest results when both are used together. Reviews of AI-enabled Lean Six Sigma report meaningful DMAIC cycle time reductions when analytics and automation support the improvement work.
How Data Analytics Improves Each DMAIC Phase
Turning that analytics capability into an actual improvement program still comes down to leadership and coordination, which is why many practitioners pair their Six Sigma and analytics skills with broader Management Certifications to build the sponsorship and cross-functional alignment these projects need to stick.
Define: Use Data to Choose the Right Problem
Bad Six Sigma projects often begin with a vague complaint: too many delays, poor service, inconsistent quality. Analytics can sharpen the problem before the team wastes a month.
Use text mining on support tickets and customer comments to spot recurring pain points.
Segment complaints by product, region, channel, or customer type.
Compare voice of the customer data with operational metrics such as churn, rework, refund rate, and SLA misses.
The test is simple. If you cannot state the defect, the customer impact, the baseline, and the business cost, you are not ready to run DMAIC.
Measure: Replace Manual Sampling Where It Makes Sense
Manual sampling still has a place, especially when measurement systems are weak. But in manufacturing, healthcare, finance, and SaaS, many processes already generate event-level data.
IoT sensors capture temperature, vibration, pressure, or cycle time. Google Analytics 4, product telemetry, Salesforce, HubSpot, ERP systems, and service platforms record user behavior and workflow movement. The job is to verify the data before you trust it.
Check for missing fields, duplicate events, time zone errors, inconsistent definitions, and measurement drift. A beautiful dashboard built on a broken data feed is just a faster way to be wrong.
Analyze: Find Root Causes Hidden in the Noise
Traditional Six Sigma tools still work: Pareto charts, cause and effect diagrams, hypothesis tests, regression, control charts. Keep them. Add modern analytics when the process is too complex for simple slicing.
Clustering can reveal defect groups that were not obvious by department or product line.
Anomaly detection can flag unusual machine behavior, claim patterns, or transaction delays.
Process mining can reconstruct actual workflows from event logs and show rework loops that no process map captured.
Predictive models can estimate which cases are likely to miss SLA targets before they fail.
Be careful. Machine learning is not root cause analysis by itself. A model may show that late approvals correlate with a document type, but your team still needs to inspect the policy, handoff, queue rule, or training gap behind it. Teams working this deep into clustering, anomaly detection, and event-log infrastructure often find a Deep Tech Certification useful for understanding the underlying data systems these techniques run on.
Improve: Test Changes Before You Roll Them Out
Analytics helps teams avoid expensive trial and error. Simulation tools can test staffing levels, queue rules, batch sizes, or machine settings before a full rollout. In digital products, disciplined A/B testing can compare onboarding flows or checkout changes using activation, conversion, retention, and complaint metrics.
One practical rule: never optimize one metric in isolation. A bank can cut loan approval time by removing checks, but if risk exposure rises, the project failed. A SaaS team can lift activation by adding prompts, but if churn rises after week four, the improvement was cosmetic.
Control: Move from Monthly Reviews to Real-Time Signals
The control phase is where many projects decay. The team fixes the issue, publishes the final deck, and the process slowly drifts back.
Real-time dashboards, statistical process control, and anomaly alerts make control more durable. Mature, data-driven organizations often combine centralized data infrastructure, designed experiments, IoT measurement, and real-time SPC to sustain 4 to 5 sigma performance. That is not magic. It is measurement discipline.
Where Six Sigma and Data Analytics Create the Most Value
Manufacturing: Predictive quality models can detect patterns that lead to scrap, downtime, or out-of-spec production. Industry 4.0 programs often pair Six Sigma with sensors, cyber physical systems, and cloud analytics.
Healthcare: Emergency department projects using patient flow data have reported large wait time reductions. Surgical infection projects use clinical and process data to standardize care and monitor compliance.
Financial services: Loan approval and onboarding processes benefit from process mining, value stream mapping, and bottleneck prediction. Some transactional projects have cut approval cycle time sharply by removing redundant checks and reentry.
SaaS and digital products: Product teams can apply Six Sigma thinking to onboarding, activation, incident response, churn reduction, and support quality using event data, micro surveys, and controlled experiments.
Skills Professionals Need Now
If you are building a career in process improvement, do not treat analytics as optional. You do not need to become a full-time data scientist. You do need enough fluency to ask better questions.
Frame problems in DMAIC terms.
Understand variation, capability, sampling, bias, and control charts.
Work with SQL extracts, dashboards, and event logs.
Interpret regression, classification, clustering, and anomaly outputs without overclaiming.
Translate findings into process changes that people will actually follow.
For structured development, look at Universal Business Council Six Sigma certifications, business analytics training, project management programs, and operations management courses. The strongest pathway is practical: learn the method, practice on real process data, then prove results through a measured improvement project. If SQL, event logs, and dashboards are the part that feels shaky, a general Tech Certification is a practical way to build that technical fluency alongside your Six Sigma training.
The Next Step
Pick one process this week where the average looks acceptable but customers still complain. Pull the data by segment and percentile, not just the mean. Build a simple DMAIC project charter from what you find. If you want formal recognition, use that project as preparation for a Universal Business Council Six Sigma certification or a related analytics course.
FAQs
1. What is Six Sigma data analytics?
Six Sigma data analytics is the use of statistical analysis, visualization, and modern analytical techniques to understand process performance and support Six Sigma improvement projects. Teams analyze data related to defects, variation, cycle times, costs, customer requirements, and operational outcomes. Six Sigma provides a structured problem-solving framework, while data analytics helps convert raw process information into useful insights. Together, they allow organizations to identify improvement opportunities, validate root causes, and make decisions based on evidence rather than assumptions.
2. How does data analytics support Six Sigma?
Data analytics supports Six Sigma by helping teams measure process performance, identify patterns, quantify variation, test suspected causes, and evaluate improvements. Analytics can reveal where defects occur, which process variables influence outcomes, and how performance changes over time. During DMAIC projects, teams may use descriptive, diagnostic, predictive, and prescriptive analytics. The analytical methods selected should match the business question and available data rather than being chosen simply because a particularly elaborate statistical technique looks impressive.
3. Why is data important in Six Sigma process improvement?
Data is essential because Six Sigma relies on measurable evidence to understand process performance and determine whether improvements actually work. Reliable data helps teams establish baselines, calculate defect rates, identify variation, compare groups, test hypotheses, and monitor results. Without dependable measurements, improvement decisions can become dominated by opinions and assumptions. Data alone is not enough, however. Teams must ensure that measurements are accurate, relevant, consistently defined, and representative of the process being studied.
4. How is data analytics used in the DMAIC methodology?
Data analytics can support every phase of DMAIC. During Define, teams analyze customer and business information to identify priorities. During Measure, they collect data and establish baseline performance. During Analyze, statistical methods help identify potential root causes. During Improve, teams evaluate experiments and pilot results. During Control, ongoing analytics monitor whether improvements remain effective. This structure turns data analysis into part of a disciplined improvement process rather than an isolated exercise in producing increasingly decorative charts.
5. What types of data analytics are used in Six Sigma?
Six Sigma projects can use descriptive, diagnostic, predictive, and prescriptive analytics. Descriptive analytics explains what has happened, while diagnostic analytics investigates why it happened. Predictive analytics estimates what may happen next, and prescriptive analytics can help evaluate possible actions. Traditional Six Sigma projects rely heavily on descriptive and diagnostic analysis, while AI and machine learning are expanding predictive capabilities. The appropriate analytical level depends on process complexity, data availability, and the decisions teams need to make.
6. What data should be collected for a Six Sigma project?
The data collected should directly relate to the problem statement, Critical-to-Quality requirements, process inputs, and desired outcomes. Examples include defect counts, cycle times, dimensions, temperatures, transaction errors, waiting times, customer complaints, equipment conditions, supplier performance, and costs. Teams should develop a clear data collection plan defining what will be measured, where the data comes from, how frequently it is collected, and who is responsible for maintaining its accuracy.
7. How does Six Sigma ensure process data is reliable?
Six Sigma uses techniques such as operational definitions, data validation, sampling plans, and Measurement System Analysis to evaluate data reliability. In manufacturing, Gage R&R can help determine whether measurement variation is acceptable. Transactional processes may require checks for missing values, inconsistent categories, duplicates, or incorrect timestamps. Establishing data quality before detailed analysis is critical because statistical sophistication cannot repair fundamentally unreliable measurements. It merely allows bad data to produce more authoritative-looking conclusions.
8. What statistical analysis techniques are commonly used in Six Sigma?
Common techniques include descriptive statistics, hypothesis testing, correlation, regression analysis, ANOVA, control charts, process capability analysis, Measurement System Analysis, and Design of Experiments. Teams may also use probability distributions and other statistical modeling techniques depending on project requirements. These methods help quantify process behavior and determine whether observed differences or relationships are meaningful. The correct technique depends on the type of data, sampling approach, statistical assumptions, and improvement question.
9. How does data analytics help identify root causes in Six Sigma?
Data analytics helps teams evaluate suspected causes using measurable evidence. Pareto analysis can identify dominant defect categories, scatter plots can reveal potential relationships, and statistical tests can compare different groups or process conditions. Regression and experimental methods can evaluate how process inputs influence outcomes. These techniques allow teams to move beyond symptoms and assumptions. Statistical relationships should still be interpreted with process expertise because correlation, despite its persistent public-relations problem, is not automatically causation.
10. What are the most important Six Sigma data analytics KPIs?
Common KPIs include defect rate, Defects Per Million Opportunities (DPMO), first-pass yield, rolled throughput yield, process capability indices such as Cp and Cpk, cycle time, rework rate, scrap rate, Cost of Poor Quality, and customer complaints. Service processes may also track waiting time, error rates, SLA performance, or first-contact resolution. KPIs should be connected to customer and business requirements so analytical efforts remain focused on outcomes that actually matter.
11. How does data visualization improve Six Sigma analysis?
Data visualization helps Six Sigma teams identify patterns, trends, distributions, and unusual observations that may be difficult to recognize in raw tables. Useful visualizations include Pareto charts, histograms, scatter plots, box plots, run charts, and control charts. Dashboards can provide ongoing visibility into performance during the Control phase. Effective visualization simplifies interpretation without hiding important statistical context. Adding more charts does not necessarily create more insight, despite what many corporate dashboards appear determined to demonstrate.
12. What software is used for Six Sigma data analytics?
Common tools include Minitab, JMP, Microsoft Excel, SigmaXL, R, Python, Power BI, Tableau, and other statistical or business intelligence platforms. Excel is useful for basic analysis and data preparation, while Minitab and JMP provide specialized statistical functionality. R and Python offer extensive flexibility for advanced analytics and automation. BI platforms are useful for dashboards and reporting. Organizations often combine several tools rather than attempting to make one application perform every analytical task.
13. How can predictive analytics enhance Six Sigma?
Predictive analytics allows Six Sigma teams to estimate future defects, failures, delays, or other process outcomes based on historical and real-time data. Regression, classification, time-series forecasting, and machine learning can identify patterns associated with elevated risk. Teams can use these predictions to take preventive action before problems occur. Predictive models should be validated and continuously monitored because changes in process conditions can reduce their accuracy over time.
14. How are AI and machine learning used in Six Sigma data analytics?
AI and machine learning can analyze large datasets, detect anomalies, classify defects, identify complex relationships, and predict process outcomes. These capabilities are particularly useful when traditional analysis struggles with large numbers of variables or nonlinear relationships. Six Sigma provides a structured framework for validating AI findings and converting them into measurable improvements. Human expertise remains essential for interpreting results, evaluating practical significance, and ensuring automated recommendations are appropriate for the operational context.
15. How can process mining complement Six Sigma data analytics?
Process mining analyzes event logs from digital systems to reconstruct how workflows actually operate. It can reveal bottlenecks, rework loops, unnecessary handoffs, waiting periods, and deviations from standard processes. Six Sigma teams can combine these findings with statistical analysis to determine which process variations significantly affect quality, cost, or cycle time. Process mining is especially valuable in transactional environments such as banking, finance, healthcare, IT, supply chain, procurement, and customer service.
16. How does Six Sigma use real-time data analytics?
Real-time analytics allows teams to monitor process performance as data is generated rather than relying entirely on historical reports. IoT sensors, manufacturing systems, transaction platforms, and digital applications can continuously provide measurements. Statistical Process Control and automated alerts can help identify unusual variation quickly. Predictive models may also estimate emerging defect risks. Real-time analytics is most effective when organizations define clear response procedures so alerts result in appropriate investigation and corrective action.
17. What are the challenges of using data analytics in Six Sigma?
Common challenges include poor data quality, missing information, inconsistent definitions, fragmented systems, insufficient sample sizes, biased datasets, and limited analytical skills. Organizations may also misuse statistical methods or mistake correlation for causation. Advanced analytics introduces additional concerns such as model drift, explainability, cybersecurity, and privacy. Successful projects require strong measurement practices, appropriate statistical expertise, process knowledge, data governance, and clear improvement objectives rather than technology alone.
18. What are the best practices for Six Sigma data analytics?
Best practices include starting with a clearly defined problem, collecting only relevant data, validating measurement systems, and selecting analytical techniques appropriate to the question. Teams should visualize data before applying complex models, verify statistical assumptions, distinguish statistical significance from practical significance, and document analytical decisions. Results should be validated through pilots or experiments where appropriate. Ongoing monitoring should then confirm that improvements remain effective after the formal project ends.
19. Can Six Sigma data analytics improve decision-making?
Yes. Six Sigma data analytics can improve decision-making by replacing subjective assumptions with measurable evidence about process performance. Teams can quantify problems, compare alternatives, estimate risks, and evaluate whether implemented changes produce meaningful results. Analytics also helps organizations prioritize improvement projects based on financial, operational, and customer impact. Better decisions emerge when analytical findings are combined with process knowledge and business context rather than treated as unquestionable outputs from statistical software.
20. What is the future of Six Sigma and data analytics?
The future of Six Sigma data analytics is likely to involve more real-time, predictive, and automated analysis. AI, machine learning, process mining, IoT, digital twins, cloud analytics, and intelligent dashboards can provide increasingly detailed insights into process behavior. Six Sigma contributes the structured methodology needed to validate these insights, identify genuine root causes, and sustain improvements. The combination can help organizations progress from analyzing historical defects toward continuously predicting, preventing, and optimizing quality and operational performance.
Related Articles
View AllSix Sigma
Six Sigma Normal Distribution: Bell Curves in Process Data
Learn how Six Sigma normal distribution explains bell curves, process spread, Cp, Cpk, and when non-normal data need different capability methods.
Six Sigma
Six Sigma vs Process Improvement: Is Six Sigma the Same Thing?
Six Sigma is a structured process improvement method, not a synonym for process improvement. Learn when to use Six Sigma, Lean, Kaizen, or simpler workflow fixes.
Six Sigma
Six Sigma vs Business Process Management: How They Work Together
Learn how Six Sigma and Business Process Management work together to reduce variation, improve workflows, and sustain process performance.
Trending Articles
The Role of Blockchain in Ethical AI Development
How blockchain technology is being used to promote transparency and accountability in artificial intelligence systems.
AWS Career Roadmap
A step-by-step guide to building a successful career in Amazon Web Services cloud computing.
Top 5 DeFi Platforms
Explore the leading decentralized finance platforms and what makes each one unique in the evolving DeFi landscape.