

Six Sigma Check Sheets Explained: Collecting Data the Simple Way
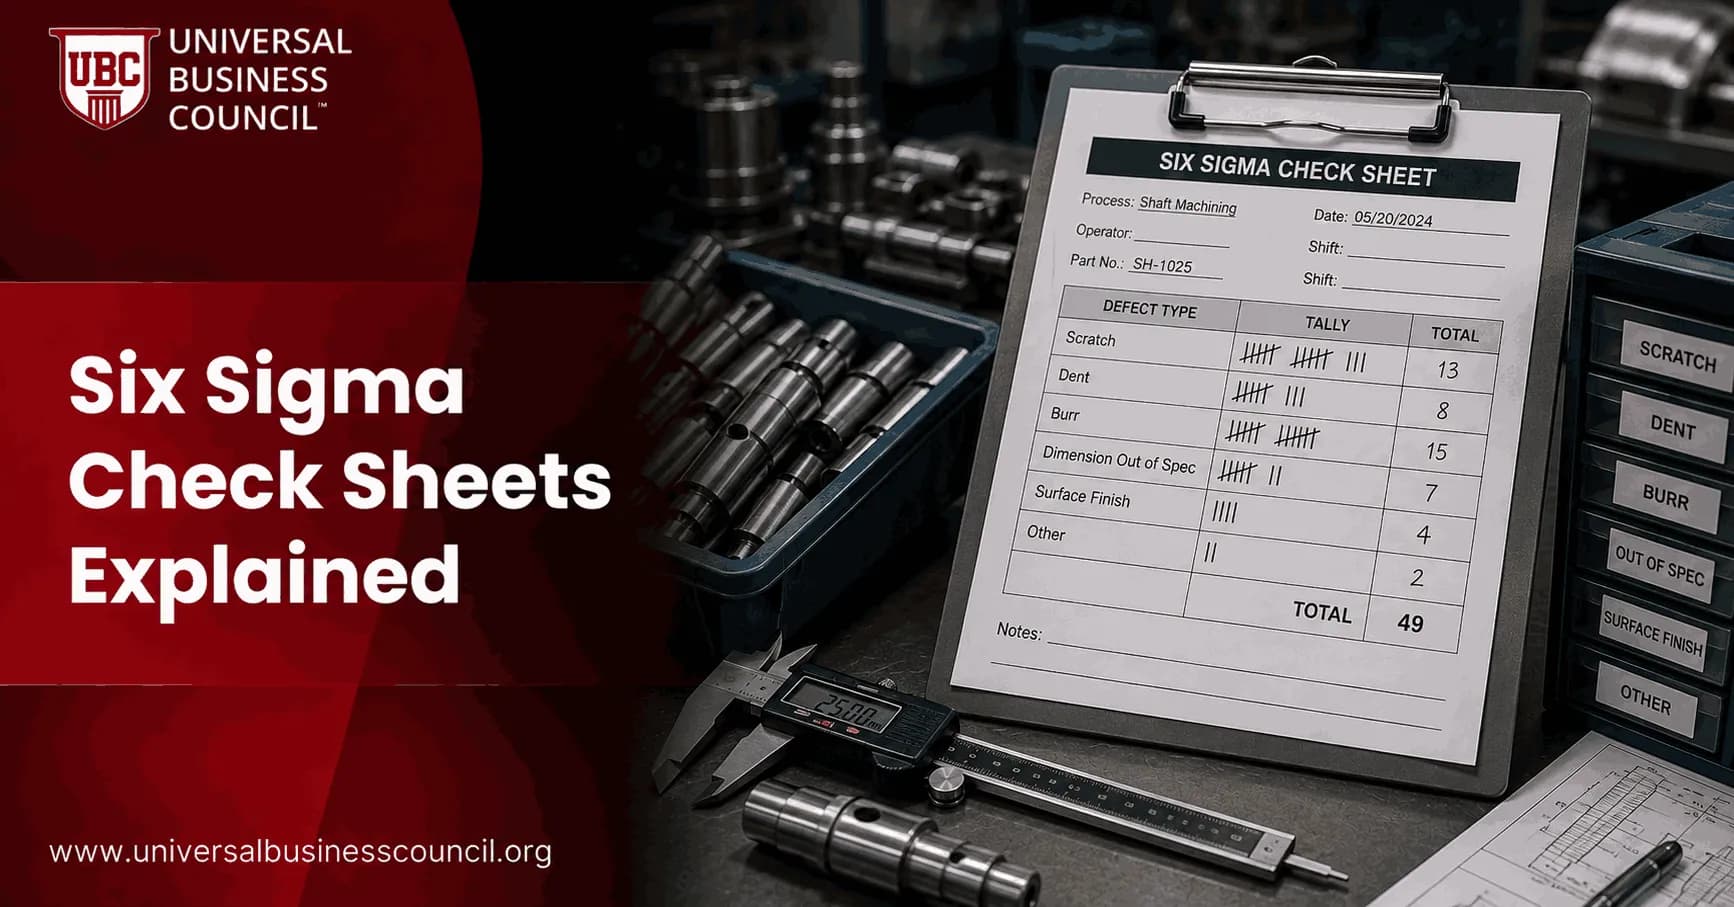
Six Sigma check sheets are the simplest reliable way to collect process data where the work actually happens. You do not need a statistics package at the workstation. You need a clear form, agreed categories, and people who know exactly when to make a tally. Professionals building this discipline often start with a focused credential like the Certified Six Sigma Expert program, since knowing which of the seven basic tools to reach for first is a judgment skill DMAIC training builds directly.
That sounds basic. It is. But basic is not weak. In Lean Six Sigma projects, check sheets often provide the first hard evidence that moves a team from opinion to measurement.

What Is a Six Sigma Check Sheet?
A Six Sigma check sheet is a structured paper or electronic form used to record real-time observations at the point of activity. Operators, nurses, analysts, supervisors, or service teams use it to count defects, delays, events, locations, or missed steps in a consistent format.
Check sheets are part of the classic Seven Quality Control tools, along with Pareto charts, histograms, cause-and-effect diagrams, control charts, scatter diagrams, and flowcharts. The check sheet usually comes first because the other tools need clean input data.
A good check sheet should be:
Simple: A busy employee should understand it in less than a minute.
Specific: Categories must match the real process, not a manager's abstract view of it.
Consistent: Two people watching the same event should record it the same way.
Actionable: The data should support a decision, not just fill a binder.
Getting frontline staff to actually treat a check sheet as a real part of the job, not a chore squeezed in between real work, is a leadership and buy-in challenge, which is why process leads often pair Six Sigma training with broader Management Certifications, covering the coaching and frontline engagement skills that keep data collection consistent instead of half-hearted.
Where Check Sheets Fit in DMAIC
Six Sigma check sheets are most common in the Measure phase of DMAIC. This is where you establish the baseline: how often a defect occurs, when delays happen, which step fails, or where rework is concentrated.
They also help in the Define phase. If a team says customer returns are getting worse, you can use a check sheet for two weeks to classify return reasons before writing the project charter. In the Control phase, the same tool can monitor whether the improved process is holding.
To be blunt, many teams skip this discipline. They jump to root cause workshops with no measured baseline. That is how you get a polished fishbone diagram built on guesswork.
Common Types of Six Sigma Check Sheets
Tally or Frequency Check Sheets
Use these when you need to count how often something happens. Examples include machine stoppages by hour, late invoices by reason, or call center escalations by category.
Defect Check Sheets
These track defect types such as scratches, missing labels, incorrect dosage entries, damaged packaging, or wrong shipment quantities. The data often feeds directly into a Pareto chart.
Location or Concentration Check Sheets
These show where defects appear. In manufacturing, you might mark dents on a product diagram. In a hospital, a team might record where interruptions occur during a procedure. Location matters because repeated clusters often point to equipment, layout, or workflow issues.
Checklist-Style Check Sheets
These verify whether required steps were completed. A 5S audit checklist is a common example. It is not just a compliance tool. If step 4 is missed on 38 percent of audits, you have useful process data.
How to Build a Check Sheet That People Will Actually Use
The design matters more than people think. I have seen check sheets fail because the categories sounded right in a conference room but made no sense on the floor. When 'Other' climbs above 20 or 30 percent, your categories are probably wrong.
Define the objective. Write one sentence: we are measuring the reasons for order rework during the packing process. Keep it narrow.
Select the data elements. Choose only the fields needed for a decision: date, shift, defect type, product line, location, or delay reason.
Match the workflow. Put the columns in the order the work happens. Do not make staff hunt across the page.
Pilot it. Test the form for a few shifts or service cycles. Look for blank fields, duplicate categories, and inconsistent marks.
Train the collectors. Use examples. If 'wrong size' and 'customer changed mind' overlap in a retail return process, define the rule.
Review the data quickly. If staff collect data and never see it used, participation drops. Share the Pareto chart or trend within days, not months.
Real Examples Across Industries
Healthcare teams have used check sheets to good effect. In one operating room pilot, a Lean Six Sigma team measured interruptions and distractions over several weeks and found pager alerts to be a leading interruption source. That is exactly what check sheets do well: they turn a vague complaint into a countable pattern.
In retail, a check sheet can classify product returns by reasons such as wrong size, defective item, changed mind, better price elsewhere, and other. If wrong size is the largest category, better sizing charts and fitting guidance become logical improvement targets.
Manufacturing examples are just as direct. Toyota built the check sheet into its Seven QC tools discipline as part of the wider Toyota Production System, using it to expose defect patterns before fixing them. The value is not the tally sheet itself. It is the decision the data supports.
The caution: the check sheet does not create gains by itself. It captures the facts. Teams still need analysis, root cause work, and process changes.
Paper, Spreadsheet, or Digital Form?
Use the format that fits the work. A laminated sheet and marker may beat a tablet in a wet production area. A Google Form, Microsoft Forms survey, or mobile quality app may be better for distributed service teams. The rule is simple: the form must be easier to use than it is to ignore.
Digital templates are growing because they cut manual transcription and can feed dashboards, Pareto charts, and statistical analysis. Still, do not digitize a poor design. Bad categories in a mobile app are still bad categories. When teams move from paper to digital and the check sheet data will not flow cleanly into the dashboards and Pareto charts it is supposed to feed, a Deep Tech Certification from Blockchain Council can help teams understand how integrated, reliable data pipelines are actually built, since a digital check sheet is only useful if the system behind it captures data faithfully.
Best Practices for Clean Data
Limit categories to what collectors can distinguish in real time.
Include a short instruction line at the top of the form.
Use time buckets that match decisions, such as shift, hour, or day.
Audit a sample of entries for consistency.
Retire fields nobody uses.
Pair the check sheet with a Pareto chart before debating solutions.
Build This Skill Into Your Six Sigma Practice
If you are preparing for a Lean Six Sigma role, do not treat check sheets as a minor exam topic. Candidates often know the definition but miss application questions that ask which tool should be used first. When the problem is unverified and you need field data, the answer is often a check sheet.
For deeper study, connect this topic with Universal Business Council learning resources on Six Sigma, quality management, process improvement, and operations management. Start small this week: pick one recurring defect, design a one-page check sheet, run a short pilot, then convert the results into a Pareto chart. That is data-driven improvement in its most practical form. If your digital check sheet keeps losing data or failing to sync with the dashboard it is meant to feed, a Tech Certification from Global Tech Council is worth adding to your plan, since some data-collection problems need better systems integration, not a better form.
FAQs
1. What is a check sheet in Six Sigma?
A Six Sigma check sheet is a structured data-collection form used to record how often specific events, defects, problems, or conditions occur. It helps teams collect consistent information directly where the work happens.
For example, a manufacturing check sheet might track scratches, cracks, missing components, incorrect labels, and dimensional defects during each shift.
The basic idea is:
Define what to observe → Record each occurrence → Summarize the data → Analyze patterns
It is deliberately simple. Quality improvement occasionally permits a tool that does not require statistical software, which must have slipped through committee review.
2. Why are check sheets important in Six Sigma?
Check sheets turn observations into structured, countable data. Instead of relying on statements such as “we seem to get lots of labeling problems,” teams can determine exactly how frequently each problem occurs.
They help improve:
Data consistency
Defect tracking
Problem identification
Data stratification
Frequency analysis
Pareto analysis
Root cause investigation
The resulting evidence can help teams decide which problems deserve priority rather than relying on memory or intuition.
3. When are check sheets used in DMAIC?
Check sheets are particularly useful during the Measure phase of DMAIC:
Define → Measure → Analyze → Improve → Control
During Measure, teams need reliable baseline data about current process performance.
Check sheets can also support:
Analyze: Identifying patterns and major defect categories.
Improve: Comparing performance before and after changes.
Control: Continuing routine monitoring after improvements are implemented.
The form may be simple, but the data can support much more sophisticated analysis later.
4. What information can a Six Sigma check sheet collect?
Check sheets can collect many kinds of operational information, including:
Defect type
Defect frequency
Defect location
Time of occurrence
Machine
Operator
Shift
Supplier
Product type
Failure cause
Customer complaint category
Service error
The categories should be defined before collection begins so different employees record the same event consistently.
Otherwise, one person's “surface damage” becomes another person's “scratch,” and the dataset immediately develops philosophical disagreements.
5. How do you create a Six Sigma check sheet?
A practical approach is:
Step 1: Define the purpose of data collection.
Step 2: Determine exactly what will be counted or recorded.
Step 3: Establish clear operational definitions.
Step 4: Select relevant categories.
Step 5: Include useful stratification fields such as shift or machine.
Step 6: Design a simple recording format.
Step 7: Train the people collecting data.
Step 8: Pilot the check sheet.
Step 9: Correct ambiguous categories.
Step 10: Collect and analyze the data.
The best check sheet is usually the one employees can complete accurately during normal work without requiring a minor administrative sabbatical.
6. What does a Six Sigma check sheet look like?
A simple defect check sheet might look like this:
Defect Type | Tally | Total |
|---|---|---|
Scratch | ` | |
Crack | ` | |
Wrong label | ` | |
Missing part | ` | |
Other | ` |
Each time a defect occurs, the inspector adds a tally.
At the end of the collection period, the totals can be analyzed directly or transferred into a Pareto chart or other analytical tool.
7. What is the difference between a check sheet and a checklist?
A check sheet collects data about occurrences or observations.
A checklist confirms that required activities have been completed.
For example:
Check sheet: How many incorrect labels occurred today?
Checklist: Was the label printer inspected before startup?
So:
Check Sheet → Data collection
Checklist → Task verification
They look similar enough to confuse people with admirable consistency, but their purposes are different.
8. What are the main types of check sheets?
Common check-sheet designs include:
Defect Classification Check Sheet: Counts defects by category.
Defect Location Check Sheet: Records where defects appear on a product.
Frequency Check Sheet: Counts how often events occur.
Cause Check Sheet: Records suspected or confirmed causes.
Measurement Distribution Check Sheet: Groups observations into predefined ranges.
Stratified Check Sheet: Separates observations by factors such as shift, machine, supplier, or operator.
The correct design depends on the question the team needs the data to answer.
9. What is a defect check sheet?
A defect check sheet records the number and type of defects observed in products, services, or transactions.
For example:
Defect | Frequency |
|---|---|
Incorrect dimension | 32 |
Surface damage | 18 |
Missing component | 11 |
Wrong label | 8 |
Packaging damage | 5 |
This immediately shows that incorrect dimensions occur most frequently.
The team can then investigate that category rather than spreading improvement effort equally across every possible defect.
10. What is a defect location check sheet?
A defect location check sheet records where defects occur physically on a product, component, or surface.
For example, inspectors might mark the location of scratches directly on a diagram of a vehicle panel.
After many observations, clusters may become visible.
If most scratches appear near one edge, the team can investigate nearby:
Handling equipment
Fixtures
Conveyors
Packaging
Operator movements
Location data can therefore reveal patterns that simple defect counts cannot.
11. How are check sheets used with Pareto charts?
Check sheets often provide the raw data used to create a Pareto chart.
The process is:
Record Defects → Count by Category → Rank Categories → Create Pareto Chart
Suppose a check sheet records:
Incorrect dimensions = 45
Scratches = 25
Wrong labels = 15
Missing components = 10
Other = 5
A Pareto chart can then rank these categories from most to least frequent and show which problems contribute most to the total.
The check sheet collects the evidence. The Pareto chart makes the priorities painfully visible.
12. How do check sheets support root cause analysis?
Check sheets can collect data by potential root-cause factors such as:
Shift
Machine
Operator
Supplier
Material lot
Product model
Time
Location
Suppose overall defects appear high.
After stratification:
Machine A = 8 defects
Machine B = 11 defects
Machine C = 47 defects
Machine C now deserves rather more attention than a general meeting titled “How Can We All Improve Quality?”
Check sheets therefore help narrow the investigation toward specific process conditions.
13. What is stratification in a check sheet?
Stratification means separating data into meaningful groups so hidden patterns become visible.
Instead of recording only:
Defects = 100
the team might record:
Shift 1 = 20
Shift 2 = 25
Shift 3 = 55
Or:
Supplier A = 15
Supplier B = 18
Supplier C = 67
This allows teams to determine whether particular categories contribute disproportionately to the problem.
Good stratification can transform a vague quality issue into a much more focused analytical question.
14. What are operational definitions in check-sheet data collection?
An operational definition specifies exactly what qualifies as a particular observation or defect.
For example, instead of defining a defect as:
“Large scratch”
a team might define it as:
“Any visible surface scratch longer than 10 mm under standard inspection lighting.”
Operational definitions help different inspectors classify the same condition consistently.
Without them, check-sheet data can reflect differences in human interpretation rather than differences in process performance.
15. How can you ensure check-sheet data is accurate?
Reliable check-sheet data requires more than placing empty boxes on a form.
Teams should:
Define categories clearly
Train data collectors
Avoid overlapping classifications
Record data close to the event
Use consistent sampling rules
Include date, time, shift, or source where relevant
Pilot the form before full use
Audit data periodically
Apply Measurement System Analysis when appropriate
For subjective classifications, an Attribute Agreement Analysis may be useful to determine whether inspectors classify observations consistently.
16. Can check sheets be used in service and transactional processes?
Yes. Check sheets are not limited to factories.
A call center might track:
Repeat calls
Incorrect routing
Long waits
Dropped calls
Escalations
A hospital might track process errors or delays.
A finance department might track:
Invoice errors
Missing approvals
Duplicate payments
Coding errors
A logistics operation might track late deliveries by reason.
Wherever events can be consistently defined and counted, a check sheet can be useful.
17. What is the difference between a check sheet and a histogram?
A check sheet is primarily a data-collection tool.
A histogram is primarily a data-analysis and visualization tool used to show the distribution of numerical measurements.
For example:
Check Sheet → Record cycle-time observations
↓
Histogram → Display how those cycle times are distributed
Some check sheets can group measurements into ranges, but the broader distinction remains:
Check sheet collects structured observations.
Histogram visualizes a numerical distribution.
18. What are common mistakes when using Six Sigma check sheets?
Common mistakes include:
Unclear categories: Different people classify the same event differently.
Overlapping categories: One defect could reasonably fit several options.
Too many fields: Data collection becomes burdensome.
No stratification: Important patterns remain hidden.
Biased sampling: Observations do not represent normal process conditions.
Changing definitions midway: Earlier and later data become difficult to compare.
Failing to analyze the results: Data is collected faithfully and then abandoned in a shared folder.
The final mistake is especially impressive. Organizations sometimes collect data with extraordinary discipline and then apparently assume the spreadsheet will improve the process through quiet contemplation.
19. What is a practical Six Sigma check-sheet example?
Suppose a distribution center wants to investigate shipping errors. It collects data for one week:
Error Type | Shift 1 | Shift 2 | Shift 3 | Total |
|---|---|---|---|---|
Wrong item | 8 | 11 | 20 | 39 |
Wrong quantity | 5 | 7 | 12 | 24 |
Missing item | 4 | 6 | 10 | 20 |
Wrong label | 2 | 3 | 8 | 13 |
Damaged item | 3 | 4 | 5 | 12 |
The check sheet reveals two useful patterns:
Wrong-item errors are the largest category.
Shift 3 has substantially more errors across several categories.
The team can now investigate picking methods, staffing, training, workload, equipment, or other conditions associated with Shift 3.
20. How do Six Sigma check sheets improve data-driven decision-making?
Check sheets create a simple bridge between what people observe and what teams can analyze.
A practical Six Sigma workflow is:
Define the Problem
↓
Define What Must Be Measured
↓
Create Operational Definitions
↓
Design Check Sheet
↓
Collect Data at the Source
↓
Stratify by Relevant Factors
↓
Summarize Frequencies
↓
Create Pareto Charts or Other Analyses
↓
Investigate Root Causes
↓
Implement Improvements
↓
Continue Monitoring
Their strength is simplicity. A check sheet does not attempt to prove causation, calculate process capability, or perform hypothesis testing. It does something more basic and essential: it creates structured evidence about what is actually happening.
That makes check sheets particularly valuable early in Six Sigma investigations. Before teams can calculate DPMO, build Pareto charts, test hypotheses, or identify root causes, somebody has to collect reliable data.
The central principle is:
Do not begin with “What do we think happens most often?”
Begin with:
“How can we collect enough consistent data to find out?”
That is the humble job of the check sheet. No algorithm, no intimidating equation, barely even a chart. Just disciplined data collection, quietly preventing another improvement project from being governed by whoever remembers last Tuesday most vividly.
Related Articles
View AllSix Sigma
Six Sigma DPMO Explained: Defects Per Million Opportunities Made Simple
Learn Six Sigma DPMO in plain language, including the formula, sigma level connection, examples, common mistakes, and practical quality uses.
Six Sigma
Six Sigma Cp and Cpk Explained: Capability Metrics Made Simple
Six Sigma Cp and Cpk explained in plain language, with formulas, benchmarks, examples, pitfalls, and practical guidance for process capability analysis.
Six Sigma
Six Sigma Minitab Explained: Statistical Software for DMAIC Projects
Learn how Six Sigma Minitab supports DMAIC projects with capability analysis, control charts, DOE, regression, Minitab Engage, and real project results.
Trending Articles
The Role of Blockchain in Ethical AI Development
How blockchain technology is being used to promote transparency and accountability in artificial intelligence systems.
AWS Career Roadmap
A step-by-step guide to building a successful career in Amazon Web Services cloud computing.
Top 5 DeFi Platforms
Explore the leading decentralized finance platforms and what makes each one unique in the evolving DeFi landscape.