

Six Sigma Data-Driven Decision Making: Using Metrics That Matter
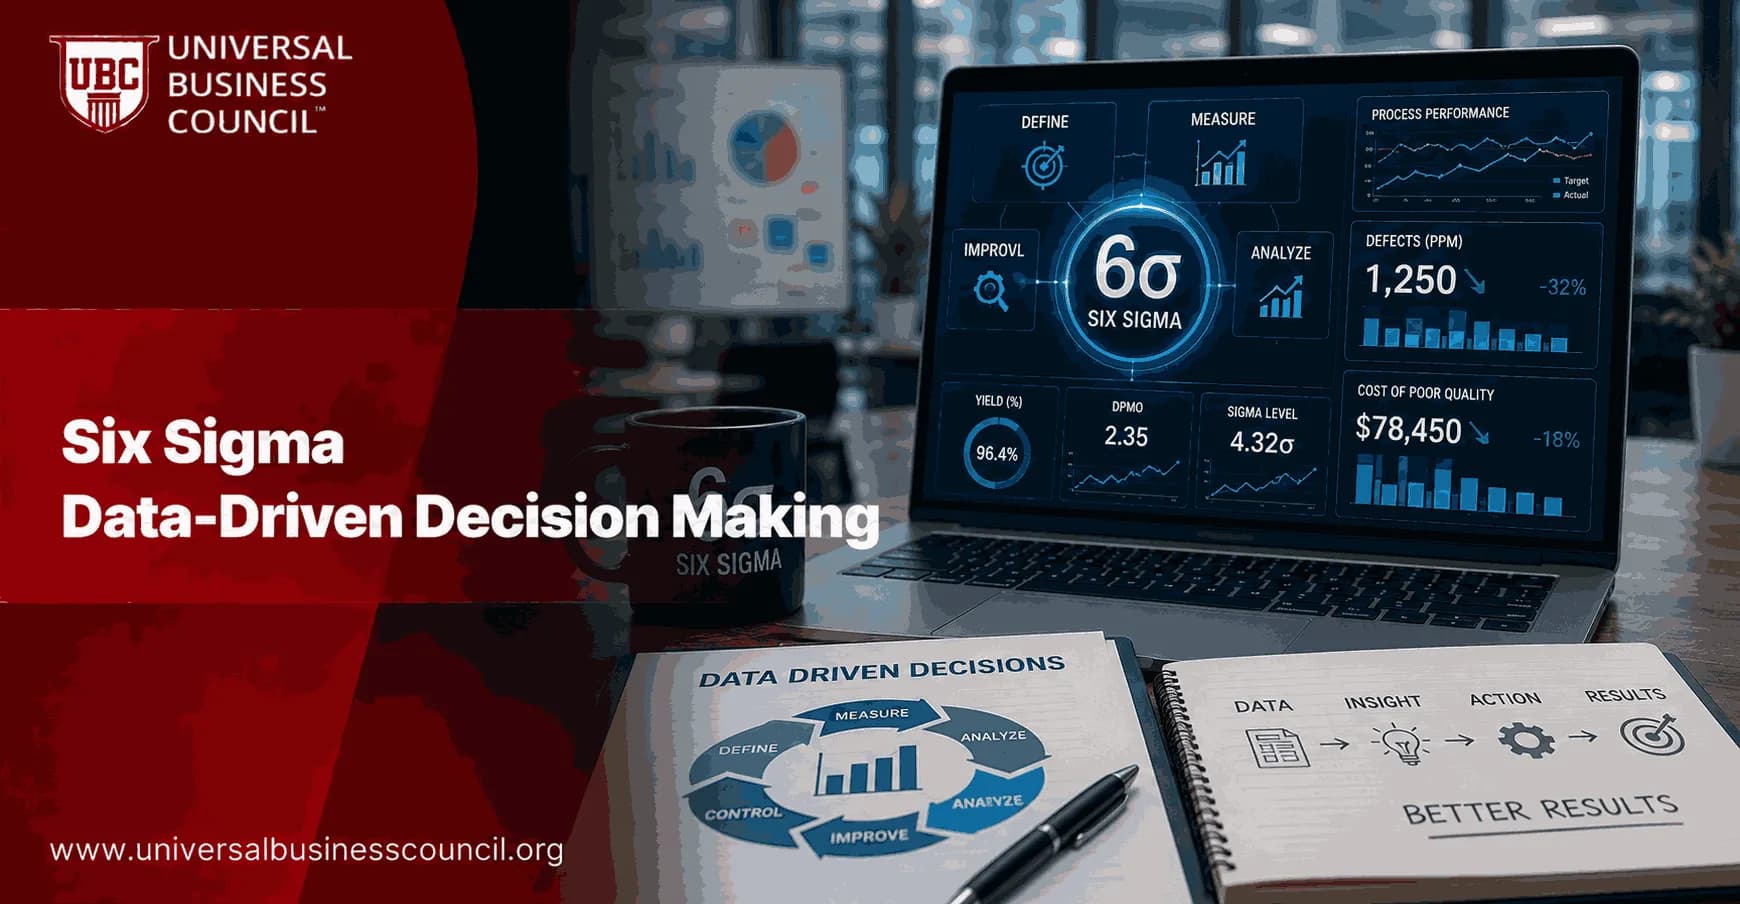
Six Sigma data-driven decision making works when you measure the few things that expose customer pain, process variation, and financial loss. Measure too much and teams drown. Measure the wrong thing and they improve a dashboard while the customer still waits.
The discipline is not just statistical. It is managerial. Good Six Sigma work connects DMAIC decisions to critical-to-quality measures, known as CTQs, so every project can answer a plain question: did the process get better in a way the customer or business can feel? For professionals developing expertise in structured process improvement, a Certified Six Sigma Expert pathway can complement this approach by strengthening their understanding of Six Sigma principles and practical quality improvement.

Why metrics selection matters in Six Sigma
Six Sigma uses the DMAIC framework: Define, Measure, Analyze, Improve, and Control. Each phase depends on evidence. In Define, you clarify the problem and CTQs. In Measure, you establish a baseline. In Analyze, you test causes instead of guessing. In Improve, you compare options. In Control, you watch whether the gains hold.
That sounds tidy. Real projects are messier.
A common mistake is measuring what is easy to pull from a system rather than what explains the defect. A support team may track average resolution time, for example, while ignoring ticket aging by queue. The average can look acceptable even when a small batch of customer-critical tickets has been stuck for nine days. In control meetings, the 90th percentile often tells the truth faster than the mean.
Data quality, technology readiness, knowledge management, and ease of use all affect whether people actually trust and use data in decisions. That matches what practitioners see: a good-looking dashboard with unclear definitions is not a decision tool. It is decoration.
For professionals who want to connect data-driven improvement with broader organizational and leadership capabilities, Management Certifications can complement Six Sigma learning by helping build the management skills needed to apply metrics effectively across teams and processes.
Metrics that matter in Six Sigma data-driven decision making
The best Six Sigma metrics are tied to CTQs and business outcomes. Keep the set small enough that a project team can explain each measure without opening a glossary.
1. Process efficiency metrics
Cycle time: time required to complete one process cycle.
Lead time: total time from customer request to delivery.
Process cycle efficiency: value-added time divided by total lead time.
Process cycle efficiency is especially useful before automation. If only a tiny fraction of lead time adds value, automating the current process may simply make waste move faster.
2. Quality and defect metrics
DPMO: defects per million opportunities, used to compare processes with different volumes or complexity.
First pass yield: the percentage of units or transactions completed correctly without rework.
Cp and Cpk: capability indices that show whether a process fits within specification limits and whether it is centered.
Certification candidates often stumble on DPMO because they count defective units instead of defect opportunities. If one application form has five fields where an error could occur, the opportunity count is not the number of forms. That distinction matters, and it shows up on exams.
3. Customer metrics
Customer satisfaction score: useful when measured close to the service event.
Order accuracy: essential in logistics and e-commerce operations.
SLA compliance: common in IT, shared services, and outsourcing contracts.
First-contact resolution: valuable in service desks and contact centers.
Do not let internal efficiency hide external failure. A team can cut handling time while pushing customers into repeat contacts. That is not improvement. It is cost shifting.
4. Financial metrics
Cost of poor quality: rework, scrap, warranty claims, complaint handling, concessions, and inspection waste.
Cost per unit: useful when quality improvements must be compared with operating expense.
Rework cost: a direct signal that the process is not producing right-first-time output.
COPQ is often the metric that gets leadership attention because it converts variation into money. Still, it should not stand alone. A lower COPQ paired with worse customer satisfaction is a warning sign.
How to choose the right Six Sigma metrics
Use this practical filter before adding a metric to a DMAIC project:
Link it to a CTQ: if the customer or regulator does not care, challenge why it is there.
Write an operational definition: state exactly what is counted, when it is counted, and who owns the data.
Establish the baseline first: capture current defect rate, lead time, FPY, Cpk, or satisfaction before changing the process.
Balance speed, quality, customer, and cost: one metric can be gamed. A balanced set is harder to distort.
Review by segment: look by product, queue, region, shift, supplier, or customer type. Averages hide variation.
To be blunt, if a metric cannot change a decision, remove it. It may be interesting, but it is not useful.
Six Sigma metrics across industries
In IT operations, teams often monitor mean time to resolve, incident volume, ticket aging, backlog, SLA compliance, change success rate, and change failure rate. These measures help decide whether the answer is better release gating, automation, staffing changes, or clearer incident routing.
In pharmaceutical manufacturing, capability indices, defect rates, and adherence to specifications matter because quality failures can become compliance failures. In logistics and e-commerce, order accuracy, delivery time, and customer satisfaction carry more weight. In education and public sector work, Lean Six Sigma projects may track attendance rates, graduation rates, or administrative cycle time.
The method stays consistent. The metric set changes with the CTQ.
For professionals working at the intersection of data-driven processes and emerging technologies, Deep Tech Certification can provide complementary technical exposure that supports a broader understanding of modern digital systems, analytics, and technology-enabled operations.
The future: dashboards need governance
Digital tools have made KPI reporting faster, but speed is not the same as reliability. Six Sigma data-driven decision making will lean more on real-time dashboards, analytics platforms, and predictive models. That is useful only if definitions are standardized and data owners are clear.
For Universal Business Council learners, this is where Six Sigma training connects with business analytics, operations management, and quality leadership. Pair this article with related Universal Business Council courses on Six Sigma, business management, data analytics, and process improvement.
Build your metric set before your next DMAIC project
Pick one process this week. Define the CTQ, choose three to five metrics, write operational definitions, and capture the baseline before proposing a fix. If you are preparing for a Six Sigma certification, practice explaining why each metric belongs in Define, Measure, Analyze, Improve, or Control. That skill separates test knowledge from project leadership.
As organizations increasingly use analytics platforms and digital tools to support operational decisions, broader technology knowledge can also be useful for professionals working with modern data systems. A Tech Certification pathway can complement Six Sigma expertise by building additional technology-focused knowledge alongside process improvement skills.
FAQs
1. What is Six Sigma data-driven decision making?
Six Sigma data-driven decision making is an approach where organizations use measurable data, statistical analysis, and performance metrics to identify problems and improve processes. Instead of relying on assumptions or opinions, Six Sigma teams use facts to understand variation, find root causes, and select improvement actions. Data becomes the foundation for decisions, because guessing remains a surprisingly popular business strategy despite its terrible success rate.
2. Why is data important in Six Sigma?
Data is important in Six Sigma because quality improvement depends on understanding process performance objectively. Data helps teams measure defects, identify variation, validate root causes, and confirm whether improvements are successful. Without reliable data, organizations may fix the wrong problems or implement solutions that do not create meaningful results.
3. What does data-driven mean in Six Sigma?
Being data-driven in Six Sigma means using collected evidence and statistical insights to guide process improvement decisions. Teams measure current performance, analyze trends, test improvement ideas, and monitor results using measurable indicators. The approach ensures decisions are based on actual process behavior rather than assumptions, opinions, or the loudest person in the meeting.
4. How does Six Sigma use metrics to improve processes?
Six Sigma uses metrics to measure quality, efficiency, cost, customer satisfaction, and process stability. Metrics help teams understand where problems exist and determine whether improvements are working. By tracking meaningful indicators, organizations can focus resources on changes that produce measurable business value.
5. What are the most important Six Sigma metrics?
Common Six Sigma metrics include:
Defects Per Million Opportunities (DPMO)
Defect rate
Sigma level
Process capability (Cp and Cpk)
First Pass Yield (FPY)
Cycle time
Cost of Poor Quality (COPQ)
Customer satisfaction scores
Process variation
The right metrics depend on the process goals and customer requirements.
6. How does Six Sigma identify the right metrics?
Six Sigma identifies the right metrics by connecting measurements to customer needs, business objectives, and process performance. Teams select metrics that are relevant, measurable, actionable, and capable of showing improvement. Measuring every available data point is not the same as being data-driven; it is often just creating a larger spreadsheet cemetery.
7. What role does DMAIC play in data-driven decision making?
DMAIC provides a structured method for using data throughout improvement projects:
Define: Identify the problem and goals.
Measure: Collect baseline process data.
Analyze: Use data to find root causes.
Improve: Test and implement solutions.
Control: Monitor results and maintain performance.
DMAIC ensures decisions are supported by evidence at every stage.
8. How does Six Sigma use statistical analysis?
Six Sigma uses statistical analysis to understand variation, identify patterns, test relationships, and predict process behavior. Tools such as regression analysis, hypothesis testing, control charts, and capability analysis help teams make informed decisions. Statistics allow organizations to separate meaningful signals from normal process noise.
9. How do control charts support Six Sigma decisions?
Control charts help teams monitor whether processes remain stable over time. They identify unusual variation, trends, and potential problems before they become major failures. Control charts support ongoing decision making by showing whether corrective actions are improving process performance or simply creating temporary changes.
10. What is the role of dashboards in Six Sigma decision making?
Six Sigma dashboards present important metrics visually so teams can quickly understand process performance. Dashboards may display defect trends, project status, quality indicators, and operational results. They help leaders make faster decisions by turning complex data into understandable information. A good dashboard highlights decisions; a bad one displays every number imaginable and hopes someone finds meaning.
11. How does Six Sigma use root cause analysis with data?
Six Sigma uses data to move beyond symptoms and identify the true causes of problems. Tools such as Pareto charts, Fishbone diagrams, regression analysis, and the 5 Whys help teams investigate failure sources. Data-based root cause analysis prevents organizations from applying quick fixes that allow the same problems to return later.
12. How does data help reduce process variation?
Data helps organizations identify where and why variation occurs. By measuring process inputs, outputs, and performance trends, Six Sigma teams can determine which factors create inconsistency. Reducing unnecessary variation improves reliability, lowers defects, and creates more predictable outcomes.
13. How does Six Sigma support predictive decision making?
Six Sigma increasingly uses predictive analytics, machine learning, and real-time monitoring to forecast future process behavior. Predictive methods help organizations identify potential defects, equipment failures, and quality risks before they occur. This shifts Six Sigma from reactive problem solving toward proactive improvement.
14. What is the role of data visualization in Six Sigma?
Data visualization helps Six Sigma teams understand complex information through charts, graphs, dashboards, and process maps. Visual tools make trends, variation, and performance gaps easier to identify. Effective visualization improves communication between technical teams, managers, and stakeholders who may not enjoy reading statistical reports for recreation.
15. How does Six Sigma use customer data?
Six Sigma uses customer data such as complaints, surveys, reviews, service records, and satisfaction scores to identify improvement opportunities. Customer insights help define quality requirements and measure whether processes are meeting expectations. This ensures improvement projects focus on outcomes that matter to customers.
16. What are the challenges of data-driven Six Sigma?
Common challenges include:
Poor data quality
Incomplete measurements
Data silos
Incorrect metric selection
Lack of analytical skills
Resistance to evidence-based decisions
Difficulty connecting metrics to business goals
Good decisions require good data. Unfortunately, organizations often discover their data problems only after buying expensive tools to analyze the bad data.
17. How can companies improve Six Sigma data quality?
Companies can improve data quality by standardizing collection methods, defining clear measurement processes, automating data capture, training employees, and regularly validating information. Reliable data creates reliable improvement decisions. Poor data can lead even skilled Six Sigma teams toward incorrect conclusions.
18. How do AI and analytics enhance Six Sigma decision making?
AI and analytics enhance Six Sigma by analyzing larger datasets, identifying hidden patterns, predicting failures, and generating faster insights. Machine learning can support defect prediction, anomaly detection, and process optimization. These technologies expand Six Sigma capabilities while maintaining the discipline of structured improvement methods.
19. What skills are needed for data-driven Six Sigma?
Professionals working with data-driven Six Sigma need:
Six Sigma methodology knowledge
Statistical analysis skills
Data visualization ability
Process improvement expertise
Analytical thinking
Business understanding
Digital tools knowledge
Modern quality professionals increasingly combine traditional improvement skills with analytics capabilities.
20. What is the future of Six Sigma data-driven decision making?
The future of Six Sigma will rely increasingly on real-time data, artificial intelligence, predictive analytics, and automated performance monitoring. Organizations will use advanced metrics to identify risks earlier and optimize processes continuously. Six Sigma will continue evolving from measuring past performance toward creating intelligent systems that predict and prevent future problems.
Related Articles
View AllSix Sigma
Six Sigma Pp and Ppk Explained: Performance Metrics and Interpretation
Learn how Six Sigma Pp and Ppk measure long term process performance, how to interpret values, and when to compare them with Cp and Cpk.
Six Sigma
Six Sigma Cp and Cpk Explained: Capability Metrics Made Simple
Six Sigma Cp and Cpk explained in plain language, with formulas, benchmarks, examples, pitfalls, and practical guidance for process capability analysis.
Six Sigma
Six Sigma Probability Explained: Using Chance to Understand Risk
Six Sigma probability turns uncertainty into measurable defect, failure, and risk estimates so teams can make better quality decisions.
Trending Articles
The Role of Blockchain in Ethical AI Development
How blockchain technology is being used to promote transparency and accountability in artificial intelligence systems.
AWS Career Roadmap
A step-by-step guide to building a successful career in Amazon Web Services cloud computing.
Top 5 DeFi Platforms
Explore the leading decentralized finance platforms and what makes each one unique in the evolving DeFi landscape.