

Six Sigma Cost of Poor Quality: Finding Hidden Losses
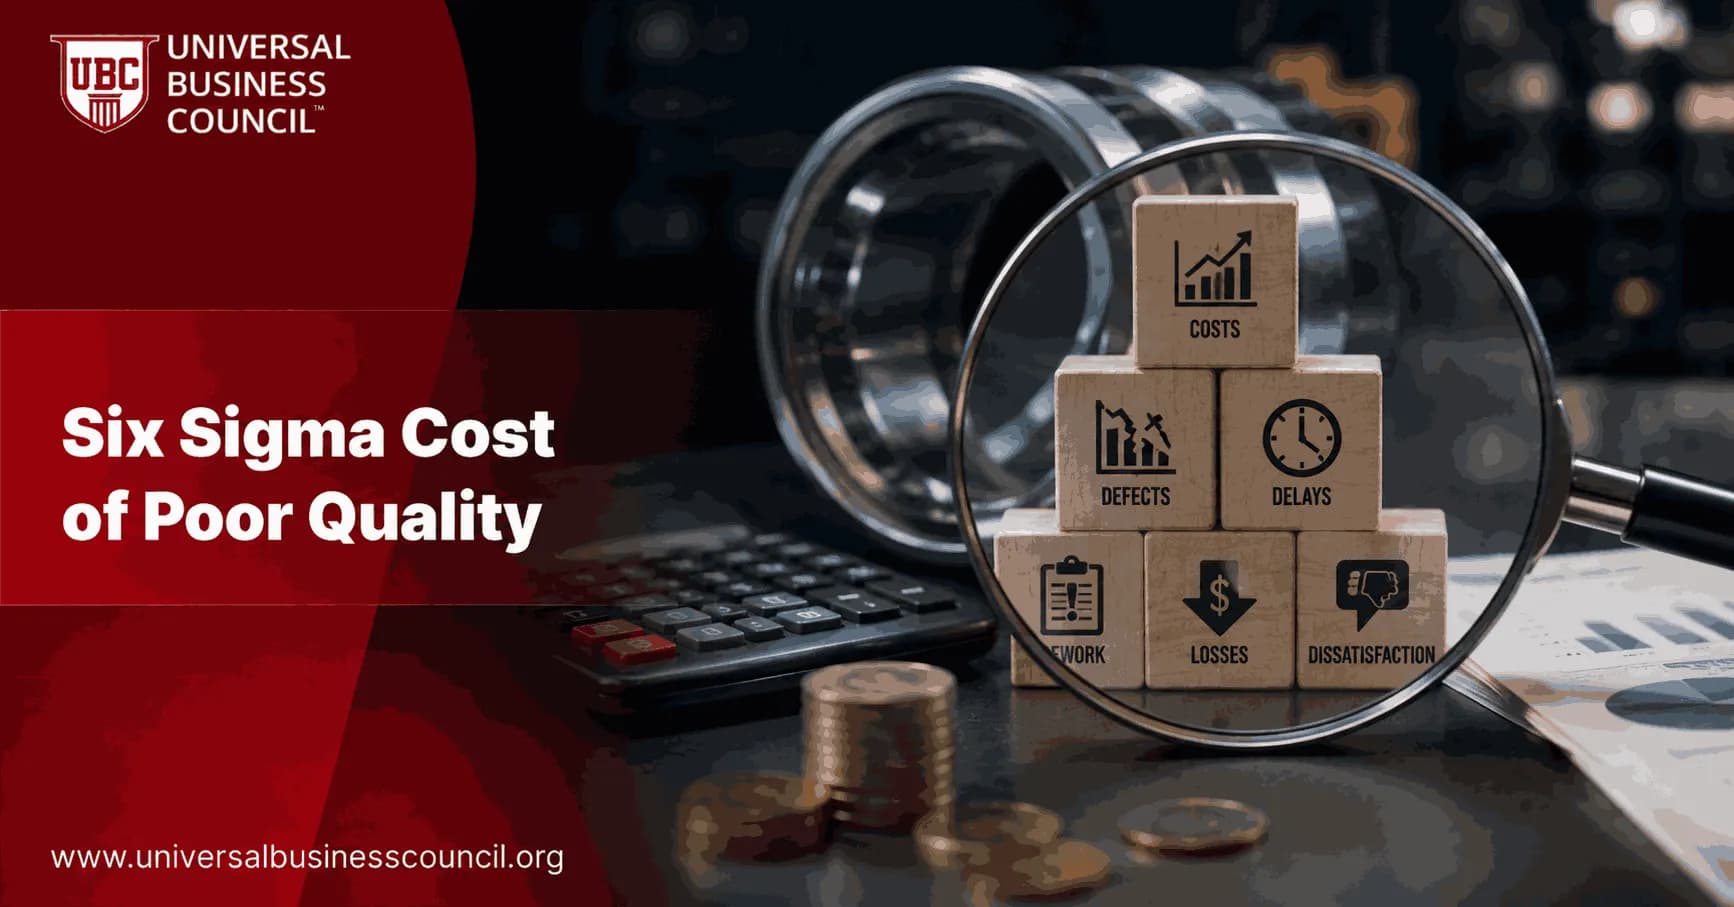
Six Sigma Cost of Poor Quality, often shortened to COPQ, is the money your organization loses when work is not done right the first time. It covers scrap, rework, downtime, warranty claims, complaint handling, lost customers, and the quiet productivity drain that rarely shows up as one neat line in the general ledger. Professionals who want to move beyond a single belt and speak this language fluently with finance often pursue a broader credential such as the Certified Six Sigma Expert designation, which folds COPQ analysis, financial framing, and DMAIC discipline into one program.
That last part matters most. Take a manufacturing case documented by CAI Software: a quality failure showed roughly 20,000 USD in scrap and rework, but the estimated lost future revenue from the damaged customer relationship reached 200,000 USD. The visible cost was not the real cost.

What is Cost of Poor Quality in Six Sigma?
In Six Sigma, Cost of Poor Quality is the total financial impact of defects and missed requirements. It gives your DMAIC project a business reason, not just a defect count. A defect rate may interest the quality team. A 900,000 USD annual loss gets the CFO's attention.
Most Six Sigma teams group COPQ into four cost types:
Internal failure costs: Scrap, rework, re-inspection, delays, and downtime found before delivery.
External failure costs: Warranty claims, returns, repairs, recalls, penalties, field service, and customer churn.
Appraisal costs: Inspection, testing, audits, sampling, and quality reviews.
Prevention costs: Training, process capability studies, preventive maintenance, design reviews, and mistake-proofing.
Here is the trade-off. Appraisal feels safe because you catch defects. Prevention is usually better because you stop creating them. Bayer HealthCare's COPQ work makes the point: preventive action costs rose from 0.2 percent to 0.6 percent of total costs, while total COPQ fell from 9.3 percent to 6.8 percent. Reported annual savings included about 2.068 million USD from reduced scrap and rework.
Where hidden COPQ usually sits
Standard accounting captures the obvious losses and misses the operational mess around them. You have to look where people are improvising.
Engineers spending Friday afternoons sorting parts instead of improving the process.
Customer service teams writing apology emails for recurring defects.
Production planners rescheduling orders because one batch needs rework.
Sales teams discounting renewals after a late or poor-quality delivery.
Supervisors holding daily containment meetings that never reach root cause.
Try a practical test. Ask a line manager how many people touched the last serious defect after it was discovered. In many plants, the answer is not two or three. It is quality, production, maintenance, planning, logistics, finance, sales, and sometimes legal. That is COPQ hiding in payroll. Untangling that kind of cross-functional cost usually takes more than statistical training, which is why quality leads who also study general Management Certifications tend to be better at tracing hidden COPQ back through departments that never show up in a scrap report.
How to calculate Six Sigma Cost of Poor Quality
You do not need a perfect model on day one. Start with a defensible estimate, then improve it.
Define the scope. Pick a product line, service process, plant, region, or customer segment. Do not start with the whole company unless your data is already clean.
List defect types. Use the actual categories from your quality system: damaged packaging, wrong specification, late response, missing document, failed test, software defect.
Collect visible costs. Add scrap, rework labor, re-inspection, warranty, returns, shipping, field service, complaint handling, and recall costs.
Estimate hidden costs. Include downtime, lost capacity, missed orders, expedited freight, investigation time, and customer attrition where you have reasonable evidence.
Express the result clearly. Show COPQ as total cost, cost per unit, percentage of sales, or percentage of operating cost.
A simple working formula is:
COPQ = internal failure costs + external failure costs + appraisal costs + prevention costs
Some practitioners separate Cost of Poor Quality from Cost of Good Quality by excluding prevention. That can be useful for reporting. For Six Sigma project selection, I prefer the four-part view because it shows whether you are spending too much on inspection and too little on prevention.
Examples that show the size of the problem
Manufacturing and supplier quality
CAI Software describes an automotive brake component case where a miscalibrated machine created a defect the customer found. Direct internal failure costs were about 20,000 USD, external failure costs about 50,000 USD, investigation and containment about 10,000 USD, and reputational damage was estimated at 200,000 USD in lost future revenue. Total COPQ passed 280,000 USD for one issue.
Practitioners also note that rework can cost three to four times the original production cost once labor, scheduling disruption, overhead, and lost capacity are included. That is why a 5 percent defect rate can be far worse than it looks on a dashboard.
Safety-critical operations
In high-risk sectors, COPQ can turn catastrophic. The 2005 BP Texas City refinery explosion killed 15 people and injured more than 180, according to the U.S. Chemical Safety Board. Weak safety systems, alarms, procedures, and management controls turned quality failures into human loss, legal exposure, regulatory scrutiny, and lasting reputational damage.
NASA's Mars Climate Orbiter is another hard lesson. The spacecraft, valued at about 125 million USD, was lost in 1999 after a unit conversion error between imperial and metric units. One unchecked interface mistake destroyed the mission.
Using DMAIC to find and reduce COPQ
Run DMAIC with financial discipline. Otherwise, your team may improve a metric that does not matter much.
Define: State the COPQ problem in financial terms. Example: warranty claims on Product A cost 420,000 USD over 12 months.
Measure: Validate defect data, cycle time, rework hours, downtime, and customer impact.
Analyze: Use Pareto charts, cause and effect diagrams, regression, hypothesis testing, and process capability analysis.
Improve: Fix root causes. Do not settle for more inspection unless the risk demands it.
Control: Track COPQ monthly by product, process, customer, and defect type.
If you are preparing for a Universal Business Council Six Sigma learning pathway, pay close attention to COPQ questions. Candidates often confuse appraisal cost with prevention cost. Inspection is appraisal. Training operators on a new standard work method is prevention. That distinction trips people up in the exam more than the formulas do.
Digital COPQ: AI, dashboards, and ESG
COPQ measurement is getting more data-driven. Sensors, manufacturing execution systems, ERP data, CRM platforms, and service tickets can now expose small losses that used to vanish into overhead. AI-assisted analysis can flag patterns in defect types, machine settings, supplier lots, or customer complaints faster than a monthly review meeting.
Digital twins help when real-world testing is expensive. You can simulate process changes, estimate failure exposure, and compare options before buying equipment or changing specifications. Some organizations are also starting to record supplier lots, calibration events, and audit trails on distributed ledgers so a COPQ dispute can be settled with an immutable record instead of a shared spreadsheet, and quality professionals working near that shift often find a Deep Tech Certification useful for understanding how that traceability layer actually works.
ESG belongs in the same conversation. Wasted material, excess energy use, safety incidents, spills, and compliance failures are quality costs with financial and social consequences. Treat them as COPQ, not side issues.
Next step: build your first COPQ register
Pick one process this week. Create a COPQ register with four columns: defect type, visible cost, hidden cost, and suspected root cause. Review the top three losses with finance and the process owner. Then choose one DMAIC project where the savings are large enough to matter.
For structured development, use Universal Business Council resources on Six Sigma, operations management, project management, and business analytics. The goal is not a prettier quality report. It is fewer defects, less waste, and financial results you can defend. If your COPQ work keeps leading you back to systems, automation, or data platforms rather than the shop floor, a general Tech Certification is a practical way to build that side of your profile alongside your quality credentials. The goal is not a prettier quality report. It is fewer defects, less waste, and financial results you can defend.
FAQs
1. What is the Cost of Poor Quality in Six Sigma?
The Cost of Poor Quality (COPQ) is the financial impact created when products, services, or processes fail to meet requirements. It can include scrap, rework, defects, returns, warranty claims, complaints, delays, inspection failures, downtime, and lost productivity. Six Sigma uses COPQ to translate quality problems into measurable business costs and prioritize improvement opportunities.
2. Why is Cost of Poor Quality important in Six Sigma?
COPQ helps organizations understand that quality problems are also financial problems. A defect rate may appear abstract, but its impact becomes clearer when translated into wasted labor, materials, refunds, lost capacity, or customer attrition. Measuring COPQ helps Six Sigma teams prioritize projects according to both process performance and potential financial benefit.
3. What is the difference between Cost of Quality and Cost of Poor Quality?
Cost of Quality (COQ) is a broader concept covering the costs of achieving and maintaining quality as well as the costs resulting from failures.
It is commonly divided into:
Prevention Costs + Appraisal Costs + Internal Failure Costs + External Failure Costs
COPQ generally focuses primarily on failure-related costs, especially internal and external failures.
Understanding both concepts helps organizations evaluate whether greater investment in prevention could reduce much larger failure costs.
4. What are the four categories of Cost of Quality?
The four common Cost of Quality categories are:
Prevention Costs: Training, process design, mistake-proofing, preventive maintenance, and quality planning.
Appraisal Costs: Inspection, testing, audits, verification, and measurement.
Internal Failure Costs: Scrap, rework, retesting, downtime, and defects found before delivery.
External Failure Costs: Returns, warranty claims, complaints, refunds, recalls, and failures discovered by customers.
These categories help organizations understand where quality-related money is being spent.
5. What are internal failure costs?
Internal failure costs arise when defects are discovered before the product or service reaches the customer.
Examples include:
Scrap
Rework
Retesting
Reinspection
Downtime
Reprocessing
Yield losses
Additional labor
Material waste
Internal failures may be less damaging than customer-facing failures, but they can still consume substantial capacity and operating expense.
6. What are external failure costs?
External failure costs occur after a defective product or service reaches the customer.
Examples include warranty claims, refunds, returns, complaint handling, field service, recalls, penalties, replacement products, and expedited shipping.
External failures can be especially expensive because they may create both direct costs and harder-to-measure consequences such as lost customer trust and reputational damage.
7. What are hidden costs of poor quality?
Hidden COPQ includes losses that may not appear in a dedicated quality-cost account.
Examples include:
Lost Productivity → Excess Capacity → Schedule Disruption → Overtime → Expediting → Repeat Customer Support → Lost Sales → Customer Churn
Other hidden costs can include management time, unnecessary inventory, delayed cash collection, repeated approvals, and opportunity costs.
These losses often make the true cost of defects considerably larger than the visible scrap or warranty expense.
8. How do you calculate Cost of Poor Quality?
A basic calculation is:
COPQ = Internal Failure Costs + External Failure Costs
For example, suppose an organization records annually:
Scrap: $120,000
Rework: $80,000
Downtime caused by defects: $50,000
Returns: $60,000
Warranty claims: $40,000
Then:
COPQ = $350,000 per year
More advanced calculations may include labor, lost capacity, customer attrition, and opportunity costs.
9. How does Six Sigma identify hidden financial losses?
Six Sigma teams map the process, collect performance data, identify defects and root causes, and quantify the resources consumed by failures.
Useful methods include:
Process mapping
Value Stream Mapping
Pareto analysis
Root-cause analysis
Activity-based costing
Process capability analysis
FMEA
Voice of the Customer
The objective is to connect process failures with measurable operational and financial consequences.
10. How does DMAIC help reduce Cost of Poor Quality?
DMAIC provides a structured approach.
Define: Identify the quality problem and financial impact.
Measure: Establish defect rates and baseline COPQ.
Analyze: Determine root causes.
Improve: Implement solutions that reduce failures.
Control: Monitor performance and financial benefits.
This prevents organizations from jumping directly from “quality costs too much” to “everyone please try harder,” a management technique with limited statistical support.
11. How can Pareto analysis help reduce COPQ?
Pareto analysis ranks defect categories or causes according to frequency, cost, or another relevant measure.
A small number of defect categories may account for a large share of total COPQ. By prioritizing these high-impact problems, Six Sigma teams can direct resources toward improvements likely to produce the greatest financial benefit.
A cost-based Pareto chart can be particularly useful because the most frequent defect is not always the most expensive.
12. How does process capability relate to Cost of Poor Quality?
Process capability measures how consistently a process operates within specification limits.
A process with poor capability can generate more defects, rework, scrap, and customer failures, increasing COPQ.
Metrics such as Cp and Cpk can help teams assess capability, but financial analysis is still necessary. Two processes with similar defect rates may produce very different costs depending on the value and consequences of each failure.
13. How can FMEA help reduce Cost of Poor Quality?
Failure Mode and Effects Analysis (FMEA) helps teams identify potential failure modes, evaluate their risks, and prioritize preventive action.
By identifying failures before they occur, organizations can reduce expensive rework, downtime, customer complaints, recalls, or safety incidents.
FMEA is especially valuable when the cost of detecting a defect late in the process is much greater than preventing it earlier.
14. What is the relationship between COPQ and the 1-10-100 rule?
The 1-10-100 rule is a simplified quality-management concept suggesting that preventing an error may cost roughly 1 unit, correcting it internally may cost 10, and addressing it after reaching the customer may cost 100.
It should not be treated as a universal financial formula. Its practical message is that failures often become more expensive the later they are discovered.
Organizations should calculate their own actual cost relationships rather than assuming the ratio applies literally.
15. How can COPQ be measured in service industries?
Service organizations can measure poor quality through errors, repeat work, delays, complaints, refunds, SLA failures, unnecessary approvals, customer-support contacts, and lost customers.
For example, a bank might calculate the cost of transaction errors and repeated customer calls. A hospital could analyze rescheduling or administrative errors. A logistics company could quantify late deliveries and claims.
COPQ is therefore not limited to manufacturing.
16. How do you calculate the cost of rework?
A basic rework calculation is:
Rework Cost = Rework Volume × Average Cost per Reworked Unit
The cost per unit may include:
Labor + Materials + Equipment Time + Inspection + Administration
For example, if 4,000 units require rework annually at an average total cost of $18 per unit:
Annual Rework Cost = 4,000 × $18 = $72,000
Additional capacity or scheduling effects may also need to be considered.
17. How do you estimate the cost of customer complaints?
Complaint costs can include customer-service labor, investigation, refunds, replacement products, shipping, credits, technical support, and management escalation.
A simple model is:
Complaint Cost = Number of Complaints × Average Handling Cost
Organizations can extend this model by estimating customer churn or lost future revenue where credible data exists. Assumptions about indirect losses should be documented rather than presented as precise accounting facts.
18. How do you prioritize Six Sigma projects using COPQ?
Rank opportunities according to factors such as:
Annual COPQ + Customer Impact + Risk + Improvement Feasibility + Strategic Importance
Projects with high financial impact and realistic improvement potential may deserve priority.
Teams should avoid choosing projects solely because the defect is visible. A less obvious process failure can create greater financial loss through repeated labor, delays, lost capacity, or customer attrition.
19. How do you verify COPQ savings after a Six Sigma project?
Compare validated post-improvement performance with the established baseline.
For example:
Baseline Rework Cost: $400,000/year
Post-Improvement Rework Cost: $220,000/year
Gross Annual Reduction: $180,000
Finance teams should verify assumptions and distinguish hard savings, cost avoidance, capacity benefits, and revenue effects.
A projected benefit becomes much more credible when finance and process owners agree on how it is calculated.
20. What is the best framework for finding hidden Cost of Poor Quality?
A practical approach is to follow the process from visible defects to financial consequences.
Start by mapping the process:
Supplier → Input → Process → Output → Customer
At each stage, ask:
Where can failure occur?
Then identify visible costs:
Scrap → Rework → Returns → Warranty → Refunds → Downtime
Next, investigate hidden costs:
Extra Labor → Overtime → Expediting → Excess Inventory → Lost Capacity → Repeated Support → Management Time
Then examine customer-related consequences:
Complaints → Churn → Lost Orders → Reputation → Service Recovery
Not every indirect consequence can be measured precisely. Use credible evidence and clearly state assumptions.
Next, calculate annualized COPQ.
For example:
Scrap: $200,000
Rework: $150,000
Defect-related downtime: $100,000
Returns: $90,000
Warranty: $60,000
Extra inspection: $40,000
Expediting: $30,000
Estimated Annual COPQ = $670,000
Then use Pareto analysis to determine which categories create the greatest losses.
Suppose:
Rework + Scrap + Downtime = 67% of COPQ
Those categories become obvious candidates for deeper root-cause analysis.
Apply DMAIC:
Define → Establish Financial Problem
Measure → Quantify Defects and COPQ
Analyze → Identify Root Causes
Improve → Eliminate or Reduce Causes
Control → Sustain Results and Verify Savings
Finally, create a COPQ dashboard containing metrics such as:
Defect Rate | Scrap Cost | Rework Cost | Return Cost | Downtime Cost | Total COPQ | COPQ as % of Sales
This turns quality from an abstract operational issue into a measurable business-performance metric.
The key lesson is simple:
Price of Conformance < Price of Repeated Failure
Organizations often scrutinize the cost of prevention because it appears clearly in budgets while tolerating failure costs scattered across production, service, logistics, warranty, customer support, and lost capacity.
Six Sigma helps gather those fragments into one financial picture.
Once the hidden losses become visible, improving quality stops looking like an expense and starts looking like what it often is: recovering money the process has been quietly setting on fire.
Related Articles
View All
Six Sigma
Six Sigma in Procurement: Improving Supplier Quality and Cost Control
Learn how Six Sigma in procurement improves supplier quality, reduces defects, controls cost, and strengthens purchase-to-pay performance with DMAIC.

Six Sigma
Six Sigma Process Mining: Finding Hidden Inefficiencies
Learn how Six Sigma process mining uses event logs and DMAIC to reveal hidden inefficiencies, reduce rework, and improve process control.

Six Sigma
Six Sigma Process Optimization: Improving Speed, Quality, and Cost
Learn how Six Sigma process optimization improves cycle time, defect reduction, and cost control across manufacturing, services, healthcare, and government.
Trending Articles
The Role of Blockchain in Ethical AI Development
How blockchain technology is being used to promote transparency and accountability in artificial intelligence systems.
AWS Career Roadmap
A step-by-step guide to building a successful career in Amazon Web Services cloud computing.
Top 5 DeFi Platforms
Explore the leading decentralized finance platforms and what makes each one unique in the evolving DeFi landscape.