

Six Sigma Measurement System Analysis: Ensuring Data Accuracy Before DMAIC Decisions
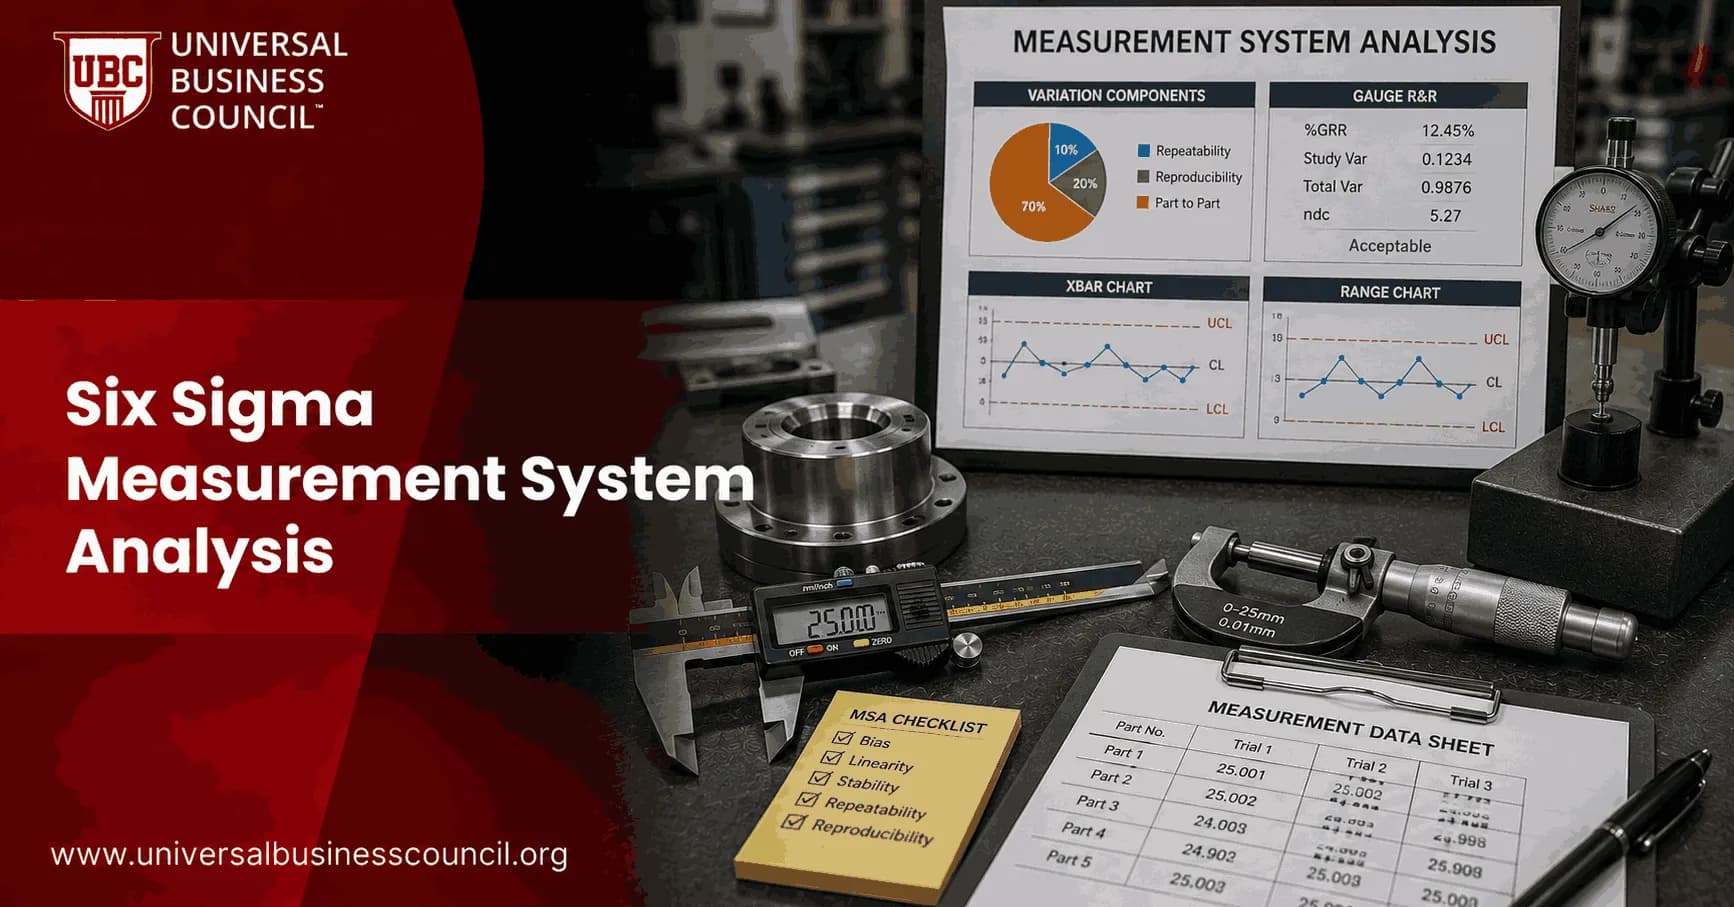
Six Sigma Measurement System Analysis answers a blunt question before you calculate capability, run a hypothesis test, or change a process: can you trust the data? If the gauge, inspector, fixture, software, or environment adds too much variation, your DMAIC project may be solving the wrong problem. Professionals building this discipline often start with a focused credential like the Certified Six Sigma Expert program, since MSA is the gate every DMAIC project has to pass before the rest of the statistics mean anything.
I have watched teams chase a machine setting for days when the real culprit was a worn locator pin on the inspection fixture. The control chart looked noisy. The machining process got the blame. A Gage R&R study exposed the truth in one afternoon.

What Six Sigma Measurement System Analysis Measures
Measurement System Analysis, usually shortened to MSA, evaluates how much observed variation comes from the measurement system rather than the process itself. In Six Sigma, this sits in the Measure phase of DMAIC, before process capability, control charts, regression, or design of experiments.
A proper MSA looks beyond the instrument. The measurement system includes:
The gauge, sensor, scanner, or test device
Fixtures and part positioning
Software logic and rounding rules
Operator technique and training
Temperature, vibration, lighting, and other environmental effects
The written inspection method and decision criteria
The main properties assessed are accuracy, precision, bias, linearity, stability, repeatability, and reproducibility. These terms are not academic decoration. They decide whether a pass or fail call is credible. Getting operators to actually follow the same inspection method consistently, especially across shifts, is a coaching and accountability challenge as much as a statistical one, which is why quality leaders often pair Six Sigma training with broader Management Certifications, covering the leadership habits that keep inspection technique from drifting between operators.
Gage R&R: The Core Method for Variable Data
For continuous measurements such as diameter, torque, thickness, temperature, or weight, the standard method is Gage Repeatability and Reproducibility. The AIAG Measurement Systems Analysis manual is the common reference in automotive and many industrial environments.
How a typical Gage R&R study is run
Select parts that cover the full process spread, not just clean samples from the middle of tolerance.
Use 2 to 3 operators who normally perform the measurement.
Have each operator measure each part multiple times.
Randomize the order so memory and sequence effects do not contaminate the result.
Analyze variation using ANOVA or variance components.
The common acceptance rules are simple, but they still need judgment:
Less than 10% GRR: acceptable for most uses.
10% to 30% GRR: may be acceptable depending on risk, cost, and how critical the application is.
Above 30% GRR: not acceptable for process decisions without improvement.
The number of distinct categories, often called ndc, should usually be at least 5. If ndc falls lower, your system cannot separate meaningful part-to-part differences. To be blunt, a capability index built on that data is mostly theater.
Attribute MSA: Where Visual Inspection Gets Exposed
Attribute Measurement System Analysis applies to pass/fail, go/no-go, defect type, or visual judgment data. It measures appraiser agreement, false accepts, and false rejects. This is where many factories are weaker than they think.
Visual inspection can look disciplined on a control plan and still vary heavily between inspectors. Attribute MSA has been used in assembly studies to pinpoint the characteristics where inspectors disagreed most. The fix was not more inspection. It was clearer boundary samples, better visual aids, and focused retraining.
Why MSA Matters for Standards and Audits
In automotive quality systems, IATF 16949:2016 clause 7.1.5.1.1 requires statistical studies of variation in the results of each measurement system referenced in the control plan. That includes Gage R&R and attribute agreement analysis where appropriate.
This requirement is often misread. It does not mean you study one micrometer and call the job done. Measurement systems with similar range and resolution can sometimes be grouped, with a representative device studied, but the logic has to be defensible. Customer-specific requirements may also apply.
Medical device, pharmaceutical, and laboratory environments use different language, such as validation, precision, method suitability, and data integrity. The principle holds. Decisions about conformity and risk are only as good as the measurement evidence behind them.
Common MSA Mistakes That Damage DMAIC Projects
Most weak MSA studies fail before the statistics start. Watch for these:
Bad part selection: using parts that do not span actual process variation.
Artificial study conditions: measuring in a quiet lab when real inspection happens beside a hot line at 2 a.m.
Ignoring fixtures: a good gauge with poor part location still gives bad data.
Overreading thresholds: 12% GRR on a safety-critical feature is not the same as 12% on a low-risk packaging dimension.
Skipping attribute studies: especially when visual inspection drives rework, scrap, or customer disputes.
An injection-molded part is a useful warning. A manufacturer saw a sink defect exceeding specification and simply added more inspection. A Gage R&R study with 10 samples, 3 operators, and 2 trials found that inconsistent part positioning under the gauge created much of the variation. Better fixturing and a clearer method prevented needless process changes.
MSA in Industry 4.0 and AI Inspection
Modern measurement systems now include sensors, firmware, data pipelines, cloud databases, vision models, and AI classification rules. That shifts the boundary of MSA. A camera system can drift. A sensor network can lose calibration. A machine learning model can perform well on last month's parts and poorly on a new supplier lot.
For digital quality systems, extend MSA thinking to:
Sensor calibration and resolution
Data availability and missing records
Database consistency
Algorithmic bias and model drift
Uncertainty estimates used in automated decisions
Metrology and AI-based measurement are moving toward continuous monitoring of measurement performance rather than occasional manual studies. That is the right direction. Periodic studies still matter, but real-time drift detection will become normal in high-volume, regulated, and automated operations. Building that kind of continuous, AI-assisted measurement pipeline is real engineering work, and a Deep Tech Certification from Blockchain Council can help teams understand how reliable, traceable data systems and model monitoring are actually built, since a vision model or sensor network is only as trustworthy as the pipeline feeding and validating it.
How to Apply MSA Before Your Next Six Sigma Decision
List every measurement system tied to your CTQs and control plan.
Classify each as variable or attribute.
Prioritize high-risk features, customer-facing defects, and data used for capability claims.
Run Gage R&R or Attribute Agreement Analysis with real operators and realistic conditions.
Fix the largest source of variation first, often fixturing, method clarity, or training.
Repeat the study after changes and document the result.
If you are preparing for a Six Sigma role, treat MSA as a practical skill, not a formula to memorize. Universal Business Council learners can connect this topic to related Six Sigma training programmes, DMAIC coursework, quality management courses, and process improvement certification pathways.
Your Next Step
Before your next capability study, pull one critical measurement from your project and ask a single question: what percentage of its variation comes from the measurement system? If you cannot answer, run an MSA first. Then build your Six Sigma decisions on data that deserve your confidence. If your sensors, databases, and inspection systems will not share consistent data in the first place, a Tech Certification from Global Tech Council is worth adding to your plan, since some measurement problems need better systems integration, not another study.
FAQs
1. What is Measurement System Analysis in Six Sigma?
Measurement System Analysis (MSA) is a structured method used in Six Sigma to determine whether the system used to collect data is sufficiently accurate, precise, stable, and consistent for decision-making.
A measurement system includes more than the gauge or instrument. It can include:
Equipment + People + Procedures + Software + Environment + Sampling + Measurement Method
The basic principle is simple: validate the measurement process before trusting the data it produces. Otherwise, DMAIC can become a remarkably sophisticated exercise in confidently analyzing bad numbers.
2. Why is Measurement System Analysis important before DMAIC decisions?
DMAIC decisions depend on reliable evidence. If the measurement system introduces excessive error, teams can misidentify root causes, exaggerate process variation, classify good products as defective, or fail to detect real improvements.
MSA helps answer:
Is the variation in our data coming from the process or from the way we measure it?
Without that distinction, capability analysis, control charts, regression, hypothesis testing, and other Six Sigma methods can produce misleading conclusions.
3. Where is MSA used in the DMAIC methodology?
MSA is most strongly associated with the Measure phase:
Define → Measure → Analyze → Improve → Control
Before analyzing baseline performance, the team verifies that the operational definitions, data-collection methods, and measurement systems are suitable.
MSA may also be repeated after equipment changes, measurement-method changes, process improvements, or during the Control phase when continued measurement reliability is critical.
4. What is considered a measurement system in Six Sigma?
A measurement system is the complete process used to assign a value or classification to something.
It may include:
Measuring instrument
Operator or inspector
Test procedure
Fixture
Software
Sampling method
Calibration process
Environmental conditions
Reference standards
Data-recording method
For transactional processes, the “measurement system” might even be people classifying customer complaints or employees entering timestamps rather than a physical gauge.
5. What are the main types of measurement error in MSA?
Common measurement-system problems include:
Bias: Measurements are systematically different from a reference value.
Repeatability: The same appraiser cannot obtain sufficiently consistent results.
Reproducibility: Different appraisers obtain different results.
Stability: Measurement performance changes over time.
Linearity: Measurement bias changes across the measurement range.
Resolution: The instrument cannot distinguish sufficiently small differences.
MSA identifies which of these problems could compromise process decisions.
6. What is measurement bias in Six Sigma?
Bias is the systematic difference between the average observed measurement and an accepted reference or master value.
Conceptually:
Bias = Average Observed Measurement − Reference Value
Suppose a certified reference is 50.00 mm and repeated measurements average 50.08 mm.
The estimated bias is:
50.08 − 50.00 = +0.08 mm
A measurement system can be highly consistent yet still biased. Precision and accuracy, inconveniently, are not interchangeable words.
7. What is repeatability in Measurement System Analysis?
Repeatability describes variation when the same operator measures the same item repeatedly using the same measurement system under consistent conditions.
For example:
Measurement 1 = 25.01
Measurement 2 = 25.06
Measurement 3 = 24.98
The spread among those measurements reflects repeatability variation.
Poor repeatability may result from instrument resolution, equipment condition, fixtures, positioning, measurement technique, or environmental influences.
8. What is reproducibility in Measurement System Analysis?
Reproducibility evaluates variation associated with different operators, inspectors, laboratories, devices, or other measurement conditions, depending on the study design.
For example:
Operator A average = 10.02 mm
Operator B average = 10.11 mm
Operator C average = 9.99 mm
Meaningful differences among operators may indicate inconsistent techniques, training, interpretation, positioning, or procedures.
Repeatability and reproducibility together form the basis of Gauge R&R analysis.
9. What is Gauge R&R and how does it relate to MSA?
Gauge Repeatability and Reproducibility (Gauge R&R) is one of the most widely used MSA techniques for continuous measurement data.
It separates observed variation into components such as:
Part-to-Part Variation
and:
Measurement Variation = Repeatability + Reproducibility components
A good Gauge R&R study helps determine whether the measurement system can reliably distinguish real differences among parts or process outputs.
Gauge R&R is therefore a type of MSA, not another name for the entire MSA discipline.
10. What is measurement system stability?
Stability refers to whether a measurement system maintains consistent performance over time.
For example, a gauge may measure accurately today but gradually drift because of:
Equipment wear
Temperature changes
Calibration drift
Sensor deterioration
Maintenance issues
Environmental changes
Teams can monitor reference samples periodically and use control charts to detect changes in measurement performance.
A measurement system that was acceptable six months ago is not granted lifetime tenure.
11. What is linearity in Measurement System Analysis?
Linearity examines whether measurement bias remains reasonably consistent across the operating range of the measurement system.
Suppose a scale performs accurately around 10 kg but increasingly overstates weight as measurements approach 100 kg.
That indicates a potential linearity problem.
A linearity study typically uses several known reference values covering the relevant measurement range and examines how estimated bias changes with reference magnitude.
12. What is measurement resolution and why does it matter?
Resolution, sometimes discussed as discrimination, describes the smallest increment a measurement system can meaningfully distinguish.
Suppose process variation occurs in increments of 0.01 mm but the instrument records only to 0.1 mm. The gauge may be too coarse to detect important differences.
Insufficient resolution can hide process variation, create repeated identical readings, and weaken control-chart or capability analysis.
More decimal places on the display do not automatically mean more useful measurement resolution. Electronics are quite capable of decorative precision.
13. What is Attribute Measurement System Analysis?
Attribute MSA evaluates measurement systems that classify items into categories rather than producing continuous numerical measurements.
Examples include:
Pass / Fail
Good / Defective
Complete / Incomplete
Correct / Incorrect
Defect Type A / B / C
An Attribute Agreement Analysis can evaluate agreement among appraisers, agreement within the same appraiser across repeated assessments, and agreement with a known standard when one is available.
This is particularly important when inspection requires human judgment.
14. What is the difference between MSA and calibration?
Calibration compares a measuring instrument against a known reference standard to evaluate and, where appropriate, adjust its measurement performance.
MSA evaluates the broader measurement process and its suitability for the intended decision.
In simple terms:
Calibration → Is the instrument aligned appropriately with a reference?
MSA → Can the complete measurement system produce trustworthy data for this application?
A perfectly calibrated instrument can still perform poorly if operators use inconsistent techniques, fixtures are unstable, or the measurement procedure is ambiguous.
15. How do you conduct a Measurement System Analysis?
A practical MSA process can follow these steps:
Step 1: Define what must be measured.
Step 2: Establish an operational definition.
Step 3: Identify the measurement system and users.
Step 4: Determine whether the data is continuous or attribute.
Step 5: Verify calibration and resolution where relevant.
Step 6: Select representative samples.
Step 7: Conduct the appropriate MSA study.
Step 8: Analyze measurement variation and error.
Step 9: Correct unacceptable measurement problems.
Step 10: Repeat the study and document the improved system.
The study should reflect normal operating conditions rather than an artificial demonstration arranged solely to make the gauge look respectable.
16. What is an acceptable measurement system in Six Sigma?
Acceptance criteria depend on the measurement method, business risk, customer requirements, and intended use.
For Gauge R&R, commonly cited guidelines include:
Less than 10% Gauge R&R → Generally acceptable
10% to 30% → May be acceptable depending on application and risk
Greater than 30% → Generally unacceptable
These are guidelines rather than universal laws.
Safety-critical, medical, aerospace, or tightly regulated processes may require considerably stricter measurement performance than low-risk internal applications.
17. How can poor measurement systems affect process capability results?
Process capability measures such as Cp and Cpk depend on estimates of process location and variation.
If measurement error adds substantial variation, observed process spread can become inflated:
Observed Variation = Actual Process Variation + Measurement Variation
The process may then appear less capable than it actually is.
Measurement error can also obscure process shifts or cause incorrect classifications near specification limits.
Therefore, teams should evaluate measurement reliability before placing too much faith in capability indices.
18. How can MSA improve root cause analysis?
Root cause analysis depends on identifying genuine relationships between process inputs and outputs.
Suppose a team believes temperature causes dimensional variation. If dimensional measurements contain excessive error, the true relationship may be weakened, exaggerated, or obscured.
A reliable measurement system provides a stronger foundation for:
Pareto analysis
Correlation
Regression
ANOVA
Hypothesis testing
Design of Experiments
Control charts
Better measurement does not guarantee correct root-cause conclusions, but bad measurement makes incorrect conclusions considerably easier.
19. What are common Measurement System Analysis mistakes?
Common MSA mistakes include:
Testing unrepresentative samples: The selected parts do not cover the relevant process range.
Ignoring operator differences: Only the most experienced inspector participates.
Allowing operators to see previous results: This can influence repeated measurements.
Confusing calibration with MSA: A calibration certificate is treated as proof that the whole measurement process is adequate.
Using the wrong study: Continuous and attribute systems require different methods.
Ignoring environmental conditions: Temperature, vibration, humidity, lighting, or contamination affects measurement.
Performing MSA once: The system changes but measurement capability is never reassessed.
A measurement study should investigate reality, not stage a small theatrical production in which the gauge is guaranteed to succeed.
20. How does MSA ensure accurate data for better DMAIC decisions?
MSA strengthens DMAIC by establishing whether process data is sufficiently trustworthy before teams make consequential decisions from it.
The logic is:
Define the metric
↓
Establish an operational definition
↓
Validate the measurement system
↓
Collect reliable baseline data
↓
Analyze process variation
↓
Identify root causes
↓
Implement improvements
↓
Verify improvement with reliable measurements
↓
Monitor the process through Control
Without MSA, a Six Sigma team may confuse measurement variation with process variation. That can lead to false root causes, unnecessary process adjustments, inaccurate capability estimates, and improvements that appear successful or unsuccessful merely because the measurement system changed.
The practical principle is therefore:
Before asking, “What does the data tell us?” ask, “How much can we trust the data?”
That is why Measurement System Analysis belongs near the foundation of data-driven Six Sigma work. Statistical software can analyze almost any dataset placed before it. It remains regrettably incapable of asking whether the person collecting that dataset used the gauge correctly.
Related Articles
View All
Six Sigma
Six Sigma in Finance: Improving Accuracy, Controls, and Efficiency
Learn how Six Sigma in Finance improves transaction accuracy, internal controls, operational risk management, and cycle time across banking and insurance.

Six Sigma
Six Sigma Minitab Explained: Statistical Software for DMAIC Projects
Learn how Six Sigma Minitab supports DMAIC projects with capability analysis, control charts, DOE, regression, Minitab Engage, and real project results.

Six Sigma
Six Sigma Excel Tools: Templates, Charts, and Analysis Techniques
Learn how Six Sigma Excel tools support DMAIC projects with templates, control charts, capability analysis, dashboards, and practical statistics.
Trending Articles
The Role of Blockchain in Ethical AI Development
How blockchain technology is being used to promote transparency and accountability in artificial intelligence systems.
AWS Career Roadmap
A step-by-step guide to building a successful career in Amazon Web Services cloud computing.
Top 5 DeFi Platforms
Explore the leading decentralized finance platforms and what makes each one unique in the evolving DeFi landscape.