

Six Sigma Performance Measurement: KPIs, Dashboards, and Scorecards
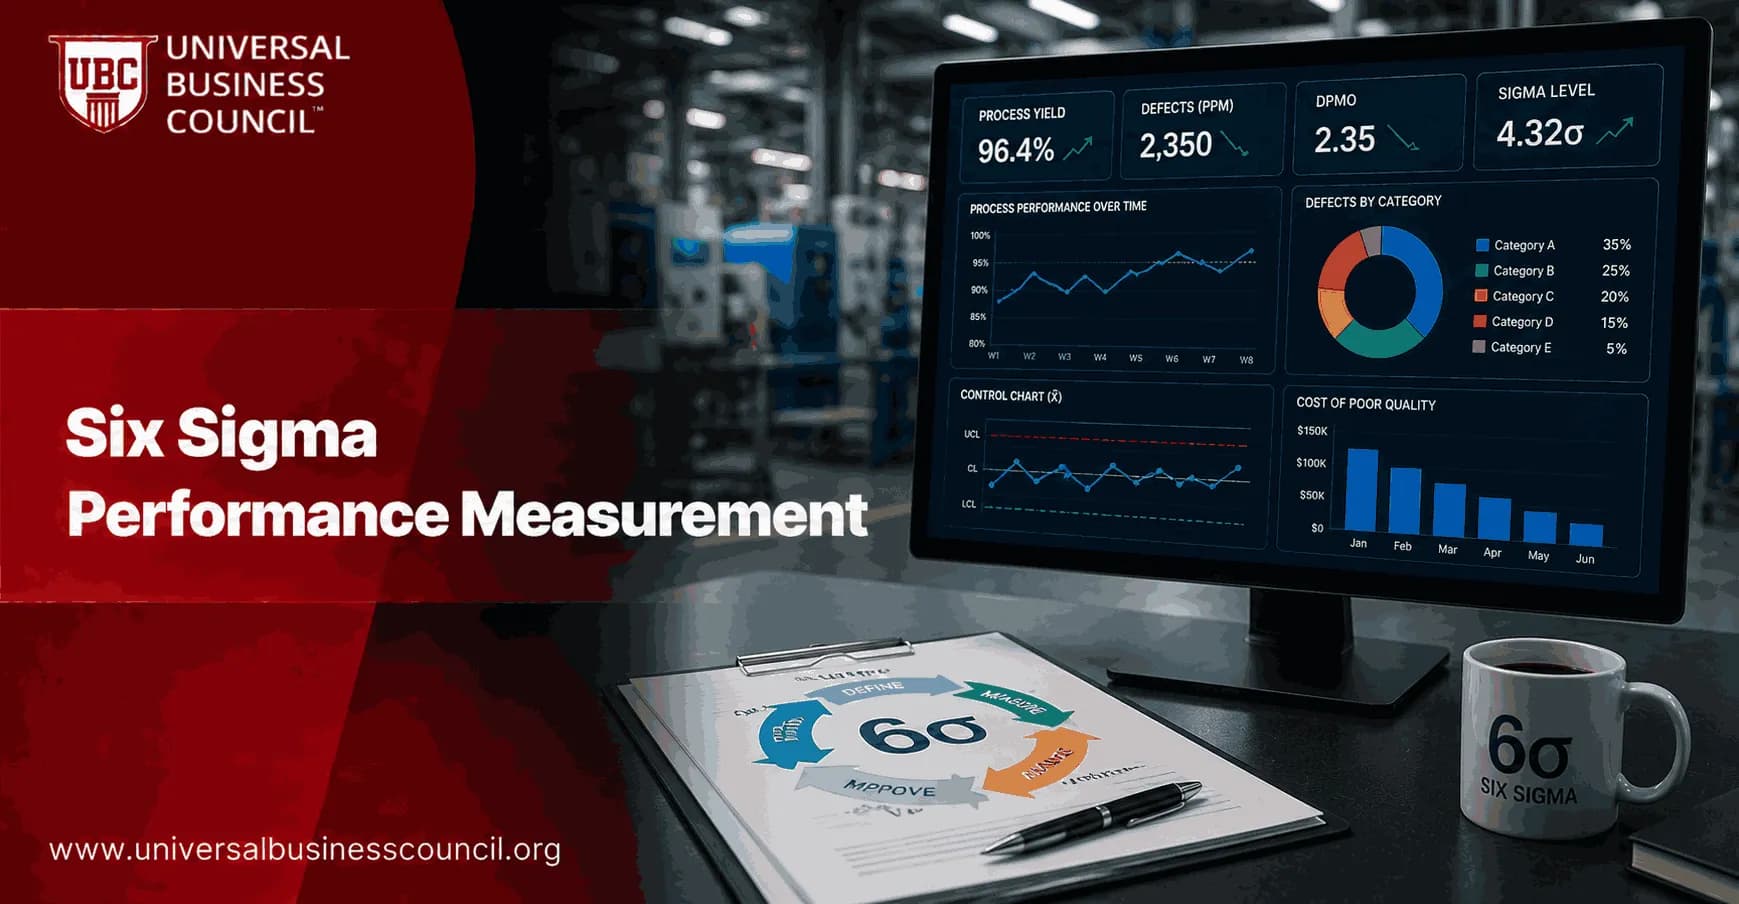
Six Sigma performance measurement turns improvement work into business evidence. KPIs tell you whether a process is improving, dashboards show what needs attention today, and scorecards connect those measures to strategy. Get the definitions wrong, though, and the whole system becomes a colorful reporting habit with very little management value. For professionals building expertise in process improvement and quality management, a Certified Six Sigma Expert pathway can provide a structured foundation for applying measurement principles within Lean Six Sigma projects.
I have watched this play out in operations reviews. A team celebrates lower average cycle time while the 90th percentile gets worse and customer complaints climb. The dashboard looked green. The process was not healthy. That is why Six Sigma measurement has to balance quality, speed, cost, and customer impact, not just the metric that is easiest to pull from a system.

What Six Sigma Performance Measurement Should Do
In Lean Six Sigma, measurement links project-level gains to outcomes leaders actually track: fewer defects, shorter lead times, lower cost of poor quality, better delivery performance, and improved customer experience. It supports DMAIC by giving teams a factual baseline in Measure, a way to test causes in Analyze, and a control system after Improve.
For professionals who want to connect quality improvement with broader leadership and organizational skills, Management Certifications can complement Six Sigma learning by covering management capabilities that support effective implementation and performance oversight.
A useful measurement system answers three questions:
Are we improving the process? Use metrics such as DPMO, first pass yield, cycle time, and process capability.
Are customers noticing? Track on-time delivery, complaints, first contact resolution, and Net Promoter Score where relevant.
Is the business better off? Monitor cost of poor quality, rework cost, warranty claims, overtime, and productivity.
KPIs: The Core of Six Sigma Measurement
A KPI is not just a number on a slide. It is a quantified measure tied to a specific objective, with a clear owner and a defined response when performance moves outside the expected range.
Every Six Sigma KPI needs an operational definition. Spell out the numerator, denominator, data source, inclusion rules, exclusions, unit of measure, and review frequency. Without that, two departments can report the same KPI name and mean completely different things.
Quality KPIs
DPMO: Defects per million opportunities, useful when processes have different numbers of defect opportunities.
First pass yield: The percentage of units that meet requirements without rework.
Scrap rate: Material or output lost because it cannot be used or sold.
Pp and Ppk: Capability indices that compare process performance with specification limits.
Speed and Delivery KPIs
Lead time: Total time from request to delivery.
Cycle time: Time required to complete a task or process step.
Queue time: Waiting time between steps, often the hidden villain in service processes.
On-time delivery: The percentage of orders or services completed by the promised time.
Cost KPIs
Cost of poor quality: Scrap, rework, returns, warranty claims, inspection, and related failure costs.
Cost per transaction: A practical efficiency measure for service teams.
Overtime hours: A warning signal when process instability is being masked by extra labor.
To be blunt, a KPI without an action rule is a decoration. If first pass yield falls below 94 percent for two consecutive shifts, who reviews it? What data is checked first? When does the team escalate? Decide this before the number turns red.
Dashboards: Real-Time Control for Daily Management
A Six Sigma dashboard pulls critical KPIs onto one screen so teams can check performance quickly. It is best used for day-to-day control, not for deep strategic evaluation.
Good dashboards are selective. A production supervisor may need FPY, scrap, hourly throughput, downtime, and top defect category. A project sponsor may need benefit realization, milestone status, risk, and customer impact. Different users need different views.
Use simple visual cues:
Current value versus target
Trend over time, not just a single snapshot
Red, amber, and green status based on agreed limits
Baseline and post-improvement performance
A short problem statement so the dashboard stays tied to the process issue
One practical warning: do not let averages dominate the page. In a contact center, average handle time can improve while long-tail waits get worse. Add percentiles or aging buckets when variation matters. Six Sigma is about variation, not just central tendency.
Scorecards: Connecting Projects to Strategy
A scorecard is a structured performance management tool. It compares performance against targets, forecasts, or strategic objectives over a longer horizon. Dashboards monitor. Scorecards evaluate.
The Balanced Scorecard, introduced by Robert Kaplan and David Norton in Harvard Business Review in 1992, still earns its place because it stops leaders from managing by financial results alone. In Six Sigma, the common perspectives are:
Financial: Cost of poor quality, savings validated by finance, margin impact.
Customer: Complaints, satisfaction, NPS, delivery reliability.
Internal process: DPMO, FPY, cycle time, capability, rework.
Learning and growth: Training completion, certification progress, improvement participation.
Scorecards earn their keep on project portfolios. A single DMAIC project might reduce rework in one product line. The scorecard shows whether that improvement supports a broader objective, such as cutting warranty expense or improving customer retention.
How to Build a Six Sigma KPI System
Start with CTQs and VOC. Translate customer needs into critical-to-quality requirements before choosing metrics.
Define each KPI tightly. Include formula, data source, owner, cadence, and response trigger.
Balance leading and lagging measures. Capability and defect signals often move before complaints and warranty costs.
Separate dashboard and scorecard use cases. Use dashboards for control meetings. Use scorecards for monthly or quarterly management review.
Audit the data. If operators do not trust the defect codes, your Pareto chart will mislead the team.
Common Mistakes That Weaken Measurement
Tracking too many KPIs, so no one knows what matters.
Changing metric definitions mid-project without marking the break in the trend.
Rewarding one metric, such as speed, while ignoring quality fallout.
Using manual spreadsheets without ownership or version control.
Reporting savings that finance has not validated.
Professionals preparing for Lean Six Sigma roles should be comfortable reading control charts, capability studies, KPI definitions, and executive scorecards. Pair this topic with the relevant Universal Business Council Six Sigma certification and process improvement courses so you can move from reporting concepts to applied DMAIC practice.
For professionals working with advanced technology and data-driven business systems, Deep Tech Certification can provide an additional technical learning pathway that complements process improvement, analytics, and modern operational practices.
Your Next Step
Pick one active process and write operational definitions for five KPIs: one quality measure, one speed measure, one cost measure, one customer measure, and one leading indicator. Then build a one-page dashboard and a monthly scorecard from the same data. If the two tools tell different stories, fix the definitions before you fix the process.
As organizations increasingly combine performance measurement with digital tools and analytics, broader technical knowledge can also help professionals understand the systems supporting modern KPI reporting. A Tech Certification pathway can complement Six Sigma expertise with additional technology-focused learning.
FAQs
1. What is Six Sigma performance measurement?
Six Sigma performance measurement is the process of tracking, analyzing, and improving process effectiveness using measurable data. It helps organizations understand whether improvement initiatives are reducing defects, lowering costs, improving efficiency, and meeting customer expectations. Performance measurement provides the evidence needed to make decisions instead of relying on assumptions, which is usually where business problems begin wearing expensive suits.
2. Why is performance measurement important in Six Sigma?
Performance measurement is important because Six Sigma focuses on data-driven improvement. Without measurement, teams cannot determine whether a process is improving or whether changes are creating unintended problems. Metrics help identify variation, monitor progress, validate improvements, and maintain long-term process control.
3. What are Six Sigma KPIs?
Six Sigma Key Performance Indicators (KPIs) are measurable values used to evaluate process quality, efficiency, and performance. KPIs help teams track whether improvement projects are achieving their objectives. Common Six Sigma KPIs include defect rates, cycle time, process capability, customer satisfaction, cost of poor quality, and productivity measures.
4. What are the most common Six Sigma performance metrics?
Common Six Sigma metrics include:
Defects Per Million Opportunities (DPMO)
Defect rate
First Pass Yield (FPY)
Process capability index (Cp and Cpk)
Sigma level
Cycle time
Lead time
Cost of Poor Quality (COPQ)
Customer satisfaction score
Process efficiency
These metrics help organizations quantify quality and operational performance.
5. What is DPMO in Six Sigma performance measurement?
Defects Per Million Opportunities (DPMO) measures the number of defects expected per one million chances for failure. It is a widely used Six Sigma metric for evaluating process quality. Lower DPMO indicates fewer defects and better process performance. Organizations use DPMO to compare processes across departments, products, and locations.
6. How is Sigma level measured?
Sigma level measures how well a process performs compared with customer requirements. A higher sigma level indicates fewer defects and lower process variation. For example, Six Sigma performance aims for approximately 3.4 defects per million opportunities under the traditional assumption of a 1.5 sigma shift. Sigma level provides a standardized way to evaluate process quality.
7. What is a Six Sigma dashboard?
A Six Sigma dashboard is a visual reporting tool that displays important quality metrics, project progress, and process performance indicators. Dashboards help teams quickly understand current performance, identify problems, and monitor improvement activities. They often include charts, graphs, trends, and real-time data updates.
8. What should be included in a Six Sigma dashboard?
A Six Sigma dashboard may include:
Defect trends
DPMO results
Sigma level tracking
Process capability metrics
Cycle-time performance
Cost savings
Project status
Customer feedback data
Corrective action progress
The best dashboards focus on decision-making rather than displaying every possible number humans have managed to collect.
9. How do Six Sigma dashboards support decision-making?
Six Sigma dashboards provide real-time visibility into process performance and help teams identify issues quickly. Leaders can use dashboards to prioritize improvement efforts, allocate resources, and track whether corrective actions are working. Visual data makes complex process information easier to understand and communicate.
10. What is a Six Sigma scorecard?
A Six Sigma scorecard is a structured performance management tool that tracks key objectives, metrics, targets, and results. Unlike dashboards that often focus on current performance visibility, scorecards emphasize strategic goals and progress toward improvement targets. They help organizations align Six Sigma projects with business objectives.
11. What is the difference between a Six Sigma dashboard and scorecard?
A Six Sigma dashboard focuses on monitoring current process conditions through visual metrics and trends. A scorecard focuses on measuring progress against strategic goals and performance targets. Dashboards answer “What is happening now?” while scorecards answer “Are we achieving our improvement objectives?” Both tools are useful because organizations somehow require multiple ways to confirm whether a process is behaving badly.
12. How do KPIs support DMAIC projects?
KPIs support DMAIC by providing measurable targets throughout each phase:
Define: Establish project goals and success criteria.
Measure: Capture baseline performance data.
Analyze: Identify causes affecting KPI performance.
Improve: Measure the impact of solutions.
Control: Maintain improvements through ongoing monitoring.
KPIs ensure Six Sigma projects remain focused on measurable outcomes.
13. How do organizations select Six Sigma KPIs?
Organizations should select KPIs based on customer requirements, business goals, process objectives, and improvement priorities. Good Six Sigma KPIs should be measurable, relevant, actionable, and connected to process performance. Choosing too many metrics can create confusion, because measuring everything is a surprisingly effective way to understand nothing.
14. How does Cost of Poor Quality (COPQ) measure Six Sigma performance?
Cost of Poor Quality measures the financial impact of defects, failures, rework, waste, returns, complaints, and inefficiencies. COPQ helps organizations understand the business value of Six Sigma improvements. Reducing COPQ demonstrates that quality improvement is not only about better processes but also about stronger financial performance.
15. How do control charts support Six Sigma performance measurement?
Control charts help monitor process stability by tracking performance over time and identifying unusual variation. They allow Six Sigma teams to distinguish between normal process variation and problems requiring investigation. Control charts are commonly used during the Control phase of DMAIC to maintain improvements.
16. How can technology improve Six Sigma dashboards?
Modern technology improves Six Sigma dashboards through:
Real-time data collection
Automated reporting
AI-based insights
Predictive analytics
Interactive visualization
Integration with business systems
Digital dashboards allow organizations to monitor processes continuously rather than waiting for periodic reports that arrive after the problem has already introduced itself.
17. How are AI and analytics used in Six Sigma performance measurement?
AI and analytics can enhance Six Sigma measurement by identifying patterns, predicting performance issues, detecting anomalies, and recommending improvement actions. Machine learning models can analyze large datasets beyond traditional reporting capabilities. This helps organizations move from measuring past performance toward predicting future process behavior.
18. What challenges affect Six Sigma performance measurement?
Common challenges include:
Poor data quality
Incorrect KPI selection
Lack of measurement consistency
Limited employee adoption
Data silos between departments
Overcomplicated reporting systems
Effective measurement requires reliable data and clear objectives. A beautifully designed dashboard showing inaccurate information is just a digital decoration with confidence issues.
19. How can companies improve Six Sigma measurement practices?
Companies can improve measurement practices by defining clear KPIs, standardizing data collection, automating reporting, training employees, and regularly reviewing metric relevance. Organizations should focus on metrics that support decisions rather than collecting numbers simply because modern software makes it easy to produce endless charts.
20. What is the future of Six Sigma performance measurement?
The future of Six Sigma performance measurement will involve real-time analytics, AI-powered dashboards, predictive KPIs, automated monitoring, and integrated quality management platforms. Organizations will increasingly use data to identify risks before failures occur and continuously optimize processes. Six Sigma performance measurement is evolving from tracking what happened to predicting what will happen next.
Related Articles
View All
Six Sigma
Six Sigma in Logistics: Cutting Delays and Improving Delivery Performance
Learn how Six Sigma in logistics reduces delays, improves on-time delivery, cuts lead time, and strengthens delivery performance through DMAIC.
Six Sigma
Six Sigma Z Score Explained: Standardizing Process Performance
Learn how Six Sigma Z score connects specification limits, sigma level, DPMO, and Cpk to compare process capability across products and services.
Six Sigma
Six Sigma Pp and Ppk Explained: Performance Metrics and Interpretation
Learn how Six Sigma Pp and Ppk measure long term process performance, how to interpret values, and when to compare them with Cp and Cpk.
Trending Articles
The Role of Blockchain in Ethical AI Development
How blockchain technology is being used to promote transparency and accountability in artificial intelligence systems.
AWS Career Roadmap
A step-by-step guide to building a successful career in Amazon Web Services cloud computing.
Top 5 DeFi Platforms
Explore the leading decentralized finance platforms and what makes each one unique in the evolving DeFi landscape.