

Six Sigma Gauge R&R Explained: Evaluating Measurement Variation
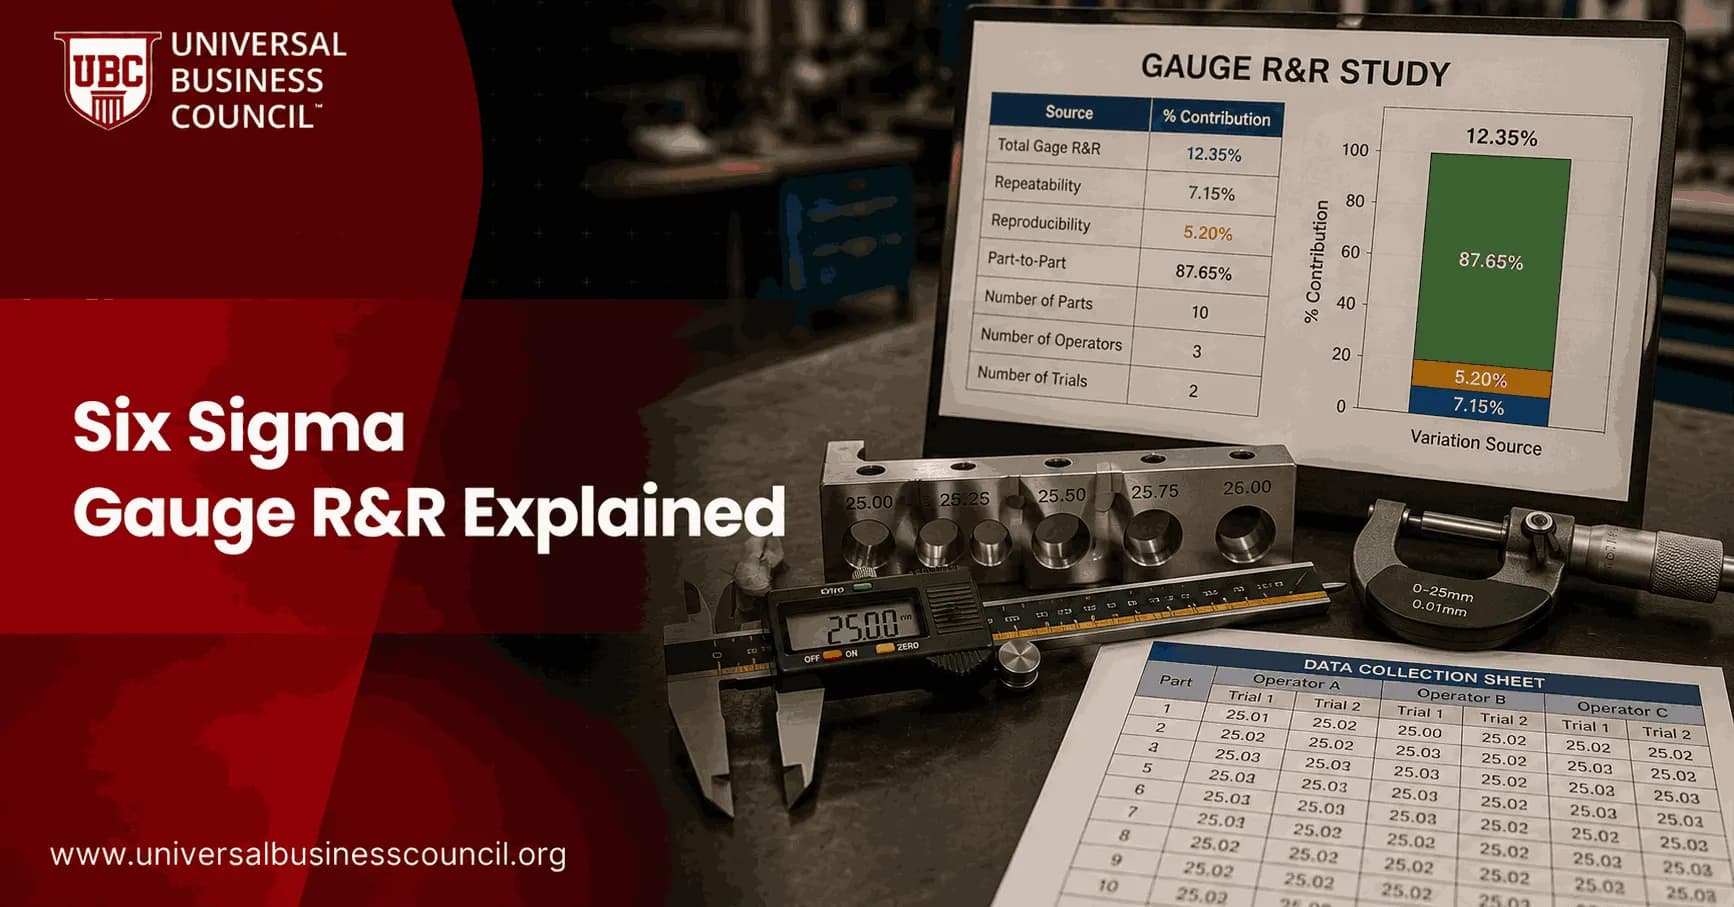
Six Sigma Gauge R&R tells you whether your data can be trusted before you run a capability study, SPC chart, or improvement project. If the measurement system is noisy, the team may end up fixing the gauge instead of the process. I have watched this happen. A digital caliper study with a tight part tolerance kept throwing unstable readings, and the real culprit was operators measuring a molded edge at slightly different contact points. Professionals building this discipline often start with a focused credential like the Certified Six Sigma Expert program, since measurement system analysis is the gate every DMAIC project has to pass through before any of the later statistics can be trusted.
What Six Sigma Gauge R&R Measures
Gauge R&R means Gauge Repeatability and Reproducibility. It sits inside measurement system analysis, often shortened to MSA, and it splits observed measurement variation into practical sources:

Part-to-part variation: the real difference between the items being measured.
Repeatability: variation when the same operator measures the same part several times with the same gauge.
Reproducibility: variation when different operators measure the same part with the same gauge.
ASQ describes Gauge R&R as a method for checking whether a gauging instrument produces repeatable and reproducible results. That sounds simple. It is not optional. Skip it, and your Cpk, control limits, defect analysis, and root cause work can all sit on bad data. Getting operators across shifts to actually follow the same measurement method consistently is a training and coaching challenge as much as a statistical one, which is why quality leaders often pair Six Sigma training with broader Management Certifications, covering the leadership and standard-work discipline needed to keep reproducibility issues from creeping back in.
How a Gauge R&R Study Is Usually Designed
A standard crossed Gauge R&R study often uses 3 operators, 10 parts, and 3 trials. Each operator measures each part multiple times, usually in randomized order so nobody memorizes readings. The parts should cover the actual process range, not just clean samples from the middle of the specification.
Use this basic setup when the same part can be measured repeatedly. For destructive testing, such as tensile testing or weld break testing, you need a different design, because the same unit cannot be measured twice. The principle holds either way: estimate how much variation comes from the measurement process rather than the product.
What the Data Should Reveal
A good study answers three questions:
Is the gauge itself precise enough?
Do operators use the method consistently?
Is most variation coming from the parts, where it should come from?
If operator variation is high, do not rush out to buy a new gauge. Watch the measurement method first. A fixture, a clearer work instruction, or a short retraining session often solves the problem faster and cheaper.
Key Gauge R&R Metrics You Need to Know
Software such as JMP, Minitab, and Excel add-ins will calculate the statistics for you. You still need to understand what they mean.
Total Gauge R&R
Total Gauge R&R combines repeatability and reproducibility. In plain terms, it is the total precision error of the measurement system. It is often reported as a percentage of study variation, tolerance, or process variation.
Percent Study Variation
Percent Study Variation compares measurement system standard deviation with total study standard deviation. When this number is small, most of the observed variation comes from real differences among parts.
Percent of Tolerance
Percent of tolerance asks a more engineering-focused question: how much of the specification band is eaten up by measurement error? JMP documentation expresses it as 100 multiplied by measurement variation divided by tolerance. Leadership tends to grasp this one quickest, because it connects directly to pass-fail decisions.
Intraclass Correlation Coefficient
The intraclass correlation coefficient, or ICC, measures the proportion of total variation caused by true part-to-part differences. A high ICC is good. It means the measurement system is not drowning out the process signal.
Acceptance Criteria: What Counts as Good?
The common Gauge R&R interpretation rules are practical, not sacred law. They show up in AIAG-style MSA practice, JMP guidance, and many Six Sigma training materials:
Under 10 percent: acceptable measurement system.
10 to 30 percent: may be acceptable depending on risk, cost, and application.
Over 30 percent: generally unacceptable. Improve or replace the system before trusting the data.
For safety-critical, regulated, or high-cost decisions, aim below 10 percent of tolerance. To be blunt, 28 percent might pass a low-risk internal screening check, but it is weak for product release or a medical device process parameter.
Average and Range vs ANOVA Methods
There are three common approaches: the range method, the average and range method, and ANOVA Gauge R&R.
The average and range method is easier to teach and still useful for basic studies. ANOVA is better when you want to estimate variance components more clearly, including operator-by-part interaction. Most serious quality teams now use ANOVA, since software has removed the calculation burden.
Choose ANOVA when the decision matters. Use simpler methods for quick screening or early training exercises.
Real Examples of Measurement Variation in Practice
A published food manufacturing Six Sigma case validated weigh-scale precision at 9.7 percent of total variation. Because the team could trust the scale data, they used regression analysis to link sanitation residue buildup to underweight defects. The project reported defect reduction from 54.55 percent to 1.35 percent and Cpk improvement from 0.17 to 1.94.
Another ANOVA-based Gauge R&R example reported total Gauge R&R near 15 percent, with most variation coming from part-to-part differences. Not perfect, but usable in many process improvement settings.
The lesson is sharp. Gauge R&R does not improve the process by itself. It tells you whether your process data deserves attention. When the underlying issue is gauges, scales, or sensors that will not feed a shared system cleanly, a Deep Tech Certification from Blockchain Council can help engineering and quality teams understand how reliable, traceable measurement pipelines are actually built, since a Gauge R&R study is only as good as the data infrastructure recording it.
Common Mistakes That Distort Gauge R&R Results
Using too narrow a part range: this can make the gauge look worse than it is.
Letting operators see previous readings: this hides repeatability problems.
Running the study straight after calibration only: real operating conditions may differ.
Ignoring fixtures and technique: hand pressure, angle, lighting, and part location all matter.
Accepting 10 to 30 percent without a plan: conditional acceptance should trigger improvement work.
Where Gauge R&R Fits in Six Sigma Training
If you are preparing for Six Sigma work, treat Gauge R&R as a gate before Analyze and Improve. It belongs before capability analysis, hypothesis testing, DOE, and control planning. Universal Business Council learners can use this topic as a natural bridge between measurement system analysis, process capability, and statistical process control courses.
Your next step: pick one live measurement from your workplace. Map who measures it, what gauge is used, and what decision depends on it. If that decision affects cost, quality, compliance, or customer experience, design a small Gauge R&R study before you trust the next chart. If your gauges, scales, or sensors cannot reliably feed a shared system in the first place, a Tech Certification from Global Tech Council is worth adding to your plan, since some measurement problems need better systems integration, not another study.
FAQs
1. What is Gauge R&R in Six Sigma?
Gauge R&R (Gauge Repeatability and Reproducibility) is a Measurement System Analysis (MSA) method used in Six Sigma to determine how much observed process variation comes from the measurement system itself rather than actual differences between products or parts.
Gauge R&R separates measurement variation mainly into:
Repeatability → variation from the measuring equipment or method
Reproducibility → variation associated with different operators/appraisers
The basic question is simple: Can you trust the measurement system enough to make process decisions? Improving a process based on unreliable measurements is a remarkably efficient way to optimize the wrong problem.
2. Why is Gauge R&R important in Six Sigma?
Gauge R&R is important because Six Sigma decisions depend heavily on data. If the measurement system introduces excessive variation, teams may incorrectly conclude that products differ when the apparent differences actually come from measurement error.
An unreliable measurement system can lead to incorrect defect classifications, misleading capability studies, unnecessary process adjustments, and false conclusions about improvements.
That is why Measurement System Analysis is commonly performed before relying heavily on measurement data during DMAIC.
3. What does R&R stand for in Gauge R&R?
R&R stands for Repeatability and Reproducibility.
Repeatability evaluates variation when the same appraiser measures the same item repeatedly using the same measurement system under consistent conditions.
Reproducibility evaluates variation associated with different appraisers measuring the same items.
Together, they estimate important components of measurement-system variation:
Gauge R&R = Repeatability + Reproducibility components
The exact statistical combination uses variance components rather than simply adding standard deviations.
4. What is repeatability in Gauge R&R?
Repeatability, sometimes called equipment variation, is the variation observed when the same operator repeatedly measures the same part using the same gauge under essentially the same conditions.
For example, an operator measures the diameter of one component three times:
20.01 mm → 20.05 mm → 20.02 mm
The differences among these readings contribute to repeatability variation.
Poor repeatability may result from equipment resolution, fixture problems, measurement technique, environmental conditions, or instability in the measurement method.
5. What is reproducibility in Gauge R&R?
Reproducibility evaluates measurement variation associated with different operators or appraisers.
Suppose three inspectors measure the same component:
Operator A → 10.02 mm
Operator B → 10.10 mm
Operator C → 9.98 mm
If systematic differences exist among operators, the measurement system may have a reproducibility problem.
Possible causes include inconsistent training, unclear measurement procedures, different positioning techniques, fixture use, or subjective interpretation.
6. What is the difference between repeatability and reproducibility?
The easiest distinction is:
Repeatability → Can the same operator obtain consistent results?
Reproducibility → Can different operators obtain consistent results?
If one person repeatedly obtains different values, repeatability may be poor.
If each person is individually consistent but different people obtain systematically different results, reproducibility may be poor.
Gauge R&R studies help determine which source contributes more to overall measurement variation so improvement efforts can target the correct problem.
7. How is a Gauge R&R study performed?
A typical crossed Gauge R&R study uses multiple parts, multiple appraisers, and repeated measurements.
A common arrangement might involve:
10 parts × 3 operators × 2 or 3 repeated measurements
Each operator measures each selected part multiple times, preferably in randomized order and without seeing previous results.
Statistical analysis then separates observed variation into components such as:
Part-to-part variation
Repeatability
Reproducibility
This shows how much variation originates from the actual items versus the measurement process.
8. How many parts and operators are needed for a Gauge R&R study?
There is no universal sample size for every application, but a frequently used practical design is:
10 parts × 3 operators × 2 or 3 trials
The selected parts should represent the relevant range of actual process variation. Operators should represent people who normally perform the measurement.
Using nearly identical parts can make the measurement system appear disproportionately poor because there is very little genuine part-to-part variation available for comparison.
Study design matters. Statistics remains stubbornly unable to rescue an experiment that was badly designed at the beginning.
9. What is crossed Gauge R&R?
A crossed Gauge R&R study is used when every appraiser can measure every selected part multiple times.
For example:
Operator A → Parts 1-10
Operator B → Parts 1-10
Operator C → Parts 1-10
Because each operator measures the same parts, the analysis can estimate repeatability, reproducibility, part-to-part variation, and, depending on the method, operator-by-part interaction.
Crossed studies are common when the measured items are not destroyed during measurement.
10. What is nested Gauge R&R?
A nested Gauge R&R study is appropriate when different operators cannot measure the exact same parts.
This may occur in destructive testing, where measuring the product changes or destroys it.
For example:
Operator A → Sample Group A
Operator B → Sample Group B
Operator C → Sample Group C
The samples are nested within operators rather than crossed among them. The statistical analysis differs accordingly, so choosing between crossed and nested designs is important.
11. How is Gauge R&R calculated?
Gauge R&R is usually calculated using variance components obtained through methods such as ANOVA or the average-and-range approach.
Conceptually:
Observed Variation = Part-to-Part Variation + Measurement System Variation
and:
Measurement System Variation = Repeatability + Reproducibility components
Because these are variance components, the underlying variances are combined statistically. Software such as Minitab or other statistical packages usually performs the calculations.
The useful skill is interpreting the results rather than heroically calculating variance components with a calculator.
12. What is %Gauge R&R?
%Gauge R&R expresses measurement-system variation relative to a selected reference, commonly total study variation or process variation.
Conceptually:
%GRR = Measurement System Variation ÷ Total Study Variation × 100
A smaller percentage generally indicates a better measurement system because less observed variation comes from measurement error.
However, practitioners should verify exactly which percentage their software reports. %Study Variation and %Tolerance are not the same metric, despite their shared enthusiasm for percent signs.
13. What is an acceptable Gauge R&R percentage?
A commonly used AIAG-style rule of thumb is:
Less than 10% → Generally acceptable
10% to 30% → May be acceptable depending on application, risk, cost, and improvement feasibility
Greater than 30% → Generally considered unacceptable
These thresholds should not be treated as universal laws.
A measurement system used for a safety-critical characteristic may require stricter performance than one used for a low-risk internal process indicator. Decisions should consider customer requirements and measurement consequences.
14. What is the difference between %Study Variation and %Tolerance in Gauge R&R?
%Study Variation compares measurement-system variation with the variation observed in the study.
%Tolerance compares measurement-system variation with the engineering specification or tolerance width.
These answer different questions.
%Study Variation → How large is measurement variation compared with observed process/part variation?
%Tolerance → How large is measurement variation compared with the allowed specification range?
A measurement system can therefore look different depending on which comparison is used. Reporting the percentage without identifying its denominator is an excellent recipe for an unnecessarily long quality meeting.
15. What is ndc in a Gauge R&R study?
ndc means number of distinct categories. It estimates how effectively the measurement system can distinguish different levels of part variation.
A commonly used approximation is based on the ratio of part-to-part variation to Gauge R&R variation.
Higher ndc values indicate greater discrimination.
A frequently cited guideline is:
ndc ≥ 5 → measurement system may provide useful discrimination
A very low ndc suggests the measurement system cannot reliably distinguish meaningful differences among parts, even if it produces impressively precise-looking decimal places.
16. What causes poor Gauge R&R results?
Poor Gauge R&R performance can result from several sources, including:
Insufficient gauge resolution
Poor calibration
Worn measuring equipment
Inconsistent measurement technique
Weak fixtures
Operator training differences
Ambiguous procedures
Temperature or humidity effects
Incorrect part positioning
Excessive measurement force
Poor study design
The variation should be decomposed before corrective action is selected.
If repeatability dominates, investigate the equipment and method. If reproducibility dominates, investigate operator-related differences and standardization.
17. How can you improve a poor Gauge R&R result?
Improvement begins by identifying the dominant source of measurement variation.
For poor repeatability, possible actions include:
Improve gauge resolution → Maintain/calibrate equipment → Improve fixtures → Control environment → Standardize technique
For poor reproducibility, teams might:
Improve work instructions → Train operators → Standardize positioning → Automate subjective steps → Reduce interpretation differences
After changes are implemented, repeat the Gauge R&R study to verify that the measurement system actually improved.
18. What is the difference between Gauge R&R and calibration?
Calibration and Gauge R&R answer different questions.
Calibration evaluates whether an instrument's measurements agree appropriately with a known reference standard across relevant conditions.
Gauge R&R evaluates how much variation occurs when the measurement system is used repeatedly by operators on actual parts.
Therefore:
Calibration → Is the instrument appropriately aligned with a reference?
Gauge R&R → Is the measurement process sufficiently consistent for its intended use?
A calibrated gauge can still have poor Gauge R&R because operator technique, fixtures, resolution, or environmental conditions introduce excessive variation.
19. When should Gauge R&R be performed in a Six Sigma project?
Gauge R&R is particularly important during the Measure phase of DMAIC, before teams place substantial confidence in collected measurement data.
It should also be considered when:
Introducing a new measurement system
Changing equipment
Changing measurement procedures
Training new operators
Moving equipment
Investigating inconsistent inspection results
Conducting capability studies
Making major process changes
The principle is straightforward:
Validate the measurement system before using its data to judge the process.
Otherwise, the project may spend weeks analyzing variation produced by the ruler rather than the factory.
20. How do you interpret Gauge R&R results in Six Sigma?
Gauge R&R interpretation should consider several results together rather than relying on one percentage.
A useful sequence is:
1. Review total Gauge R&R
Determine how much observed variation is attributable to the measurement system.
2. Compare repeatability and reproducibility
Identify whether equipment/method variation or operator-related variation is dominant.
3. Review part-to-part variation
A useful study should contain enough genuine differences among selected parts.
4. Examine %Study Variation and %Tolerance
Understand measurement performance relative to both observed variation and specification requirements when relevant.
5. Review ndc
Determine whether the system can distinguish enough meaningful categories of process output.
6. Investigate graphical results
Look for operator differences, inconsistent repeated measurements, unusual parts, and possible operator-by-part interactions.
The practical decision flow is:
Reliable measurement system → Trust the data → Analyze the process → Improve the process
versus:
Poor measurement system → Identify measurement variation → Improve the measurement system → Repeat MSA → Then analyze the process
Gauge R&R therefore protects one of the most basic assumptions behind Six Sigma: the numbers being analyzed should reasonably represent the process being studied.
If the measurement system contributes too much variation, sophisticated regression, capability analysis, control charts, and hypothesis tests merely become increasingly elaborate ways of analyzing unreliable data. The software will still provide six decimal places, naturally. It has no mechanism for embarrassment.
Related Articles
View AllSix Sigma
Six Sigma Standard Deviation Explained: Measuring Process Variation
Learn how Six Sigma standard deviation measures process variation, how to calculate it, and how it connects to defects, capability, control charts, and quality decisions.

Six Sigma
Six Sigma Minitab Explained: Statistical Software for DMAIC Projects
Learn how Six Sigma Minitab supports DMAIC projects with capability analysis, control charts, DOE, regression, Minitab Engage, and real project results.

Six Sigma
Six Sigma Performance Measurement: KPIs, Dashboards, and Scorecards
Learn how Six Sigma performance measurement uses KPIs, dashboards, and scorecards to connect process improvement with strategy, control, and results.
Trending Articles
The Role of Blockchain in Ethical AI Development
How blockchain technology is being used to promote transparency and accountability in artificial intelligence systems.
AWS Career Roadmap
A step-by-step guide to building a successful career in Amazon Web Services cloud computing.
Top 5 DeFi Platforms
Explore the leading decentralized finance platforms and what makes each one unique in the evolving DeFi landscape.