

Tips To Create Digital Marketing Reports Your Boss Will Love
 Smita
Smita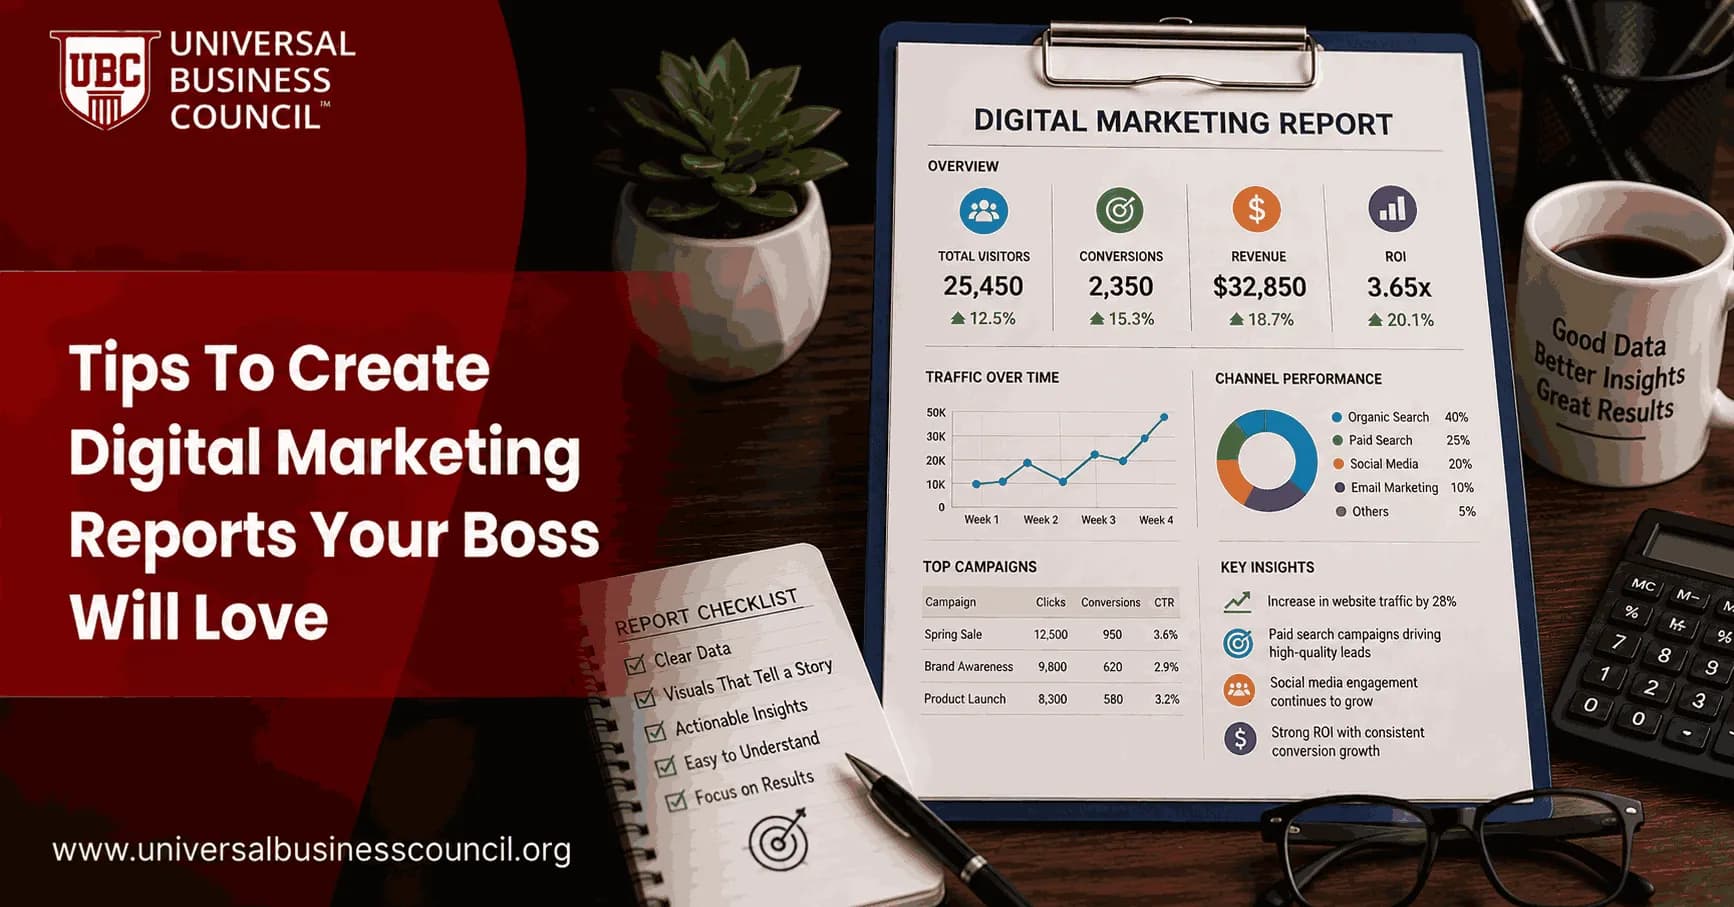
Most Marketing Reports Fail Before Anyone Even Reads Them
By 2026, 83 percent of executive teams expect marketing to demonstrate clear ROI and business impact through data-driven reporting, yet most marketing reports still fail to drive any real action, buried in vanity metrics, disconnected from actual business objectives, and too dense for a busy stakeholder to use effectively. The traditional approach of compiling a monthly spreadsheet or static PDF no longer holds up either, not when teams are managing data spanning Google Analytics, multiple paid advertising platforms, and increasingly, AI search visibility, all while navigating fragmented tracking and stricter privacy regulations. A report that takes three pages and mental math to answer "are we on track" has already lost its audience before the insight even lands.
Building the skill set needed to consistently produce reports that executives genuinely value, rather than skim and forget, starts with structured, comprehensive marketing training. A recognized Certified Digital Marketing Expert credential gives marketers a validated foundation in exactly this kind of strategic, business-aligned reporting, not just campaign execution alone.

Lead With An Executive Summary And A Single Health Indicator
Start every report the way a dashboard's strategic view would, with a summary panel showing your most critical metrics at a glance, monthly recurring revenue, customer acquisition cost, or pipeline velocity, whichever figures actually connect directly to the business's bottom line. A genuinely effective technique here is adding a single aggregate health score, a weighted combination of metrics like cost per qualified lead, lead conversion rate, and customer acquisition payback, that resolves into a simple red, yellow, or green indicator. Executives consistently respond well to single-number health indicators precisely because they answer the core question, are we on track, in seconds rather than requiring someone to interpret a dozen separate charts.
Cut Vanity Metrics And Tie Everything To Revenue Or Budget
One of the most common, costly reporting mistakes is including metrics like raw impressions, sessions, or social media follower counts that executives simply do not use to make decisions. If a metric does not tie directly to revenue, cost efficiency, or budget impact, it does not belong in a report meant for leadership. This discipline forces genuine clarity: every number included should answer a real business question, not simply demonstrate that marketing activity happened.
Applying artificial intelligence to this filtering and analysis process has become genuinely standard practice, letting teams surface the metrics that matter most without manually sorting through overwhelming raw data every reporting cycle. An AI Powered Digital Marketing Expert credential is built specifically for this shift, giving marketers the skills to use AI-driven analytics tools to identify genuinely meaningful patterns and automate the kind of metric curation that used to require hours of manual spreadsheet work.
Include AI Search Visibility Metrics Alongside Traditional KPIs
As AI-driven search platforms like ChatGPT, Perplexity, and Google's AI Overviews increasingly shape how customers discover brands, reports that only track traditional search rankings and paid media performance are already incomplete. Brand inclusion rate, how often your brand appears in AI-generated answers for priority prompts, and citation frequency, how often your own content is directly referenced as a source, have become genuinely important metrics for executive-level visibility reporting. Tracking how these figures change over time gives leadership a clear signal of whether AI search optimization efforts are actually working, the same way traditional ranking reports have always tracked SEO performance.
Pair Every Chart With A Written Insight And A Recommendation
A chart alone tells an executive what happened. It does not tell them what to do about it. Best practice guidance consistently recommends including two to three written insights alongside key visualizations, explaining clearly what the data actually means and what action is recommended as a result. This single habit is often what separates a report that gets genuinely discussed in a leadership meeting from one that gets glanced at and closed. Providing one level of supporting detail per hero metric, pipeline by source, revenue by product line, leads by channel, gives executives the option to drill deeper without cluttering the primary summary view with information they did not ask for.
Building the underlying technical infrastructure needed to automate this kind of real-time, AI-enhanced reporting, connecting data sources, building reliable dashboards, and maintaining accurate tracking amid growing privacy restrictions, requires genuine technical capability beyond marketing skill alone. A Deep Tech Certification gives marketing professionals broader exposure to the data systems and emerging technology infrastructure that increasingly underpin modern reporting tools, helping bridge the gap between marketing strategy and the technical systems that make sophisticated reporting actually possible.
Building Future-Ready Skills
As technology becomes increasingly important across industries, students need opportunities to develop future-ready skills early in their education. A World Tech Olympiad can introduce students to areas such as artificial intelligence, coding, cybersecurity, robotics, and computational thinking while encouraging curiosity and continuous learning. Early, structured exposure to this kind of analytical and technical thinking is exactly what tends to produce the detail-oriented, data-fluent professionals who go on to build reporting systems that genuinely earn executive trust rather than getting buried in an inbox.
Move From Static Reports To Live, Interactive Dashboards
Unlike a static report exported to PDF, a genuine dashboard auto-refreshes hourly, daily, or in real time, and lets stakeholders drill down into granular detail themselves without needing to ask an analyst for a follow-up pull. This interactivity, filtering by campaign, channel, or date range, and automated alerts when key metrics cross a defined threshold, transforms a report from a static snapshot into a living tool executives can actually return to between formal review meetings. Platforms like HubSpot, Tableau, Power BI, and Looker each offer different strengths here, and choosing the right one depends heavily on your existing tech stack and how deeply your organization needs metrics to stay consistent across teams.
Agree On Metric Definitions Before You Ever Present Them
A complete catalog of metrics is useful, but a metric framework the organization actually trusts is transformative. Before a report ever reaches an executive's desk, marketing, sales, and finance need to agree on shared definitions, what actually counts as a marketing-qualified lead, how an engaged session is defined, which attribution model determines credit for a conversion. Skipping this step is a common, avoidable source of confusion in boardrooms, where the same metric can mean different things depending on who pulled the number. Investing in this shared definitional groundwork, along with the underlying tracking infrastructure that supports it, is what allows reporting to survive future disruptions like privacy regulation changes or shifts in how AI platforms handle attribution.
Keeping pace with how quickly reporting tools, AI capabilities, and measurement standards continue evolving benefits from treating technical education as an ongoing habit rather than a one-time project. A broader Tech Certification in the technologies underlying modern analytics and AI-driven reporting keeps marketing professionals genuinely equipped to build dashboards and reports that remain accurate and relevant as the underlying systems keep changing.
Final Thoughts
A digital marketing report your boss will actually love is not the one with the most charts or the most exhaustive data, it is the one that answers a clear business question in seconds, ties every included metric directly to revenue or budget impact, pairs visuals with genuine written insight and recommendations, and stays accurate and current through a live, well-maintained dashboard rather than a static file that goes stale the moment it is exported. Marketers who build this discipline into their reporting process consistently earn more executive trust, and more marketing budget, than those still producing dense, vanity-metric-heavy reports built purely out of habit.
FAQs
1. What is a digital marketing report?
A digital marketing report is a structured summary of a company's online marketing performance over a specific period. It typically includes key metrics from channels such as SEO, paid advertising, social media, email marketing, website traffic, leads, conversions, and revenue.
2. Why are digital marketing reports important?
Digital marketing reports help businesses understand whether their marketing activities are producing meaningful results. They allow teams and managers to identify successful campaigns, discover problems, allocate budgets more effectively, and make data-driven decisions.
3. What should a good digital marketing report include?
A good report should include the most important KPIs, performance trends, campaign results, comparisons with previous periods, key insights, and recommended actions. The information should be organized clearly so decision-makers can understand the results without reviewing large amounts of unnecessary data.
4. Which KPIs should be included in a digital marketing report?
Important KPIs depend on the marketing goals and channels being measured. Common metrics include website traffic, impressions, clicks, click-through rate, conversion rate, leads, customer acquisition cost, return on ad spend, engagement rate, and revenue.
5. How can I make a digital marketing report easy to understand?
Use a simple structure and prioritize the metrics that directly relate to business objectives. Clear headings, concise explanations, tables, charts, and short summaries can make complex marketing data easier for managers and stakeholders to understand.
6. Should digital marketing reports include business goals?
Yes. Connecting marketing performance to business goals makes a report more valuable to decision-makers. Instead of only showing traffic or engagement, explain how marketing activities contributed to objectives such as generating leads, increasing sales, acquiring customers, or improving brand visibility.
7. How often should digital marketing reports be created?
The reporting frequency depends on the business and marketing activities. Weekly reports can help teams monitor active campaigns, while monthly reports are often useful for evaluating broader performance and trends. Quarterly reports can provide a higher-level view for strategic planning.
8. How can I show SEO performance in a digital marketing report?
SEO reports can include organic traffic, search impressions, clicks, click-through rate, keyword visibility, landing-page performance, conversions, backlinks, and technical SEO improvements. It is also useful to explain which SEO activities contributed to changes in performance rather than presenting rankings alone.
9. Should digital marketing reports compare current and previous performance?
Yes. Comparisons provide context and make performance changes easier to interpret. Depending on the objective, you can compare results with the previous week, month, quarter, year, campaign period, or a predefined target.
10. How can charts improve a digital marketing report?
Charts can make trends and comparisons easier to understand than raw numbers. Line charts can show traffic or conversion trends, while bar charts can compare channels, campaigns, or periods. Each visualization should have a clear purpose and avoid unnecessary complexity.
11. What is the best way to present negative marketing results?
Negative results should be presented honestly and explained with context. Instead of hiding poor performance, identify possible causes, describe what has been learned, and provide specific actions that can be taken to improve future results.
12. Why should digital marketing reports include insights?
Data alone does not explain what a business should do next. Insights interpret the numbers by identifying important changes, possible causes, opportunities, risks, and trends, helping managers turn marketing data into actionable decisions.
13. How can I make my digital marketing report more actionable?
End each major section with a clear recommendation or next step. For example, if a campaign has a high cost per conversion, recommend testing new audiences, creative variations, landing pages, or bidding strategies based on the available data.
14. Should digital marketing reports include all available data?
No. Including too much information can make a report difficult to understand and reduce attention on the most important findings. Focus on metrics that are relevant to the report's purpose and business goals, while keeping detailed data available separately when needed.
15. How can I make a digital marketing report look professional?
Use consistent formatting, clear headings, logical sections, readable charts, accurate data, and concise explanations. A professional report should also clearly identify the reporting period, objectives, major achievements, challenges, and recommended actions.
16. What is the role of data visualization in digital marketing reports?
Data visualization helps transform large amounts of marketing data into understandable patterns and trends. Effective visualizations allow managers to quickly identify changes in performance, compare channels, and recognize areas that require attention.
17. How can I use storytelling in a digital marketing report?
Marketing reporting can follow a simple story: what happened, why it happened, and what should happen next. This approach connects metrics with business context and helps stakeholders understand not just the results but also their implications.
18. What mistakes should be avoided when creating digital marketing reports?
Common mistakes include reporting irrelevant metrics, using confusing charts, presenting data without context, ignoring negative results, failing to compare performance, and providing no recommendations. Reports should focus on clarity, accuracy, relevance, and actionable insights.
19. How can I create a digital marketing report that my boss will value?
Focus the report on business impact rather than simply listing marketing activities. Highlight the most important results, explain significant changes, connect performance to goals, identify challenges, and provide clear recommendations for the next reporting period.
20. What is the best structure for a digital marketing report?
A practical structure is executive summary, goals and KPIs, channel performance, key insights, challenges, campaign highlights, and recommended next steps. This format gives decision-makers a quick overview while still providing enough detail to understand performance and plan future actions.
Related Articles
View AllDigital Marketing
KPIs for Digital Marketing Campaigns in Programmatic Advertising
Learn how to choose KPIs for digital marketing campaigns using programmatic advertising, from reach and CTR to CPA, ROAS, CAC, and revenue impact.
Digital Marketing
How AI and Automation Power Programmatic Advertising in Modern Digital Marketing
AI now drives programmatic advertising through automated bidding, targeting, creative optimization, privacy-safe identity, and cross-channel measurement.
Digital Marketing
Building a Full-Funnel Digital Marketing Strategy with Programmatic Advertising
Learn how to build a full-funnel digital marketing strategy with programmatic advertising across awareness, consideration, conversion, and retention.
Trending Articles
The Role of Blockchain in Ethical AI Development
How blockchain technology is being used to promote transparency and accountability in artificial intelligence systems.
AWS Career Roadmap
A step-by-step guide to building a successful career in Amazon Web Services cloud computing.
Top 5 DeFi Platforms
Explore the leading decentralized finance platforms and what makes each one unique in the evolving DeFi landscape.