

Six Sigma Process Mapping: How to Visualize and Improve Workflows
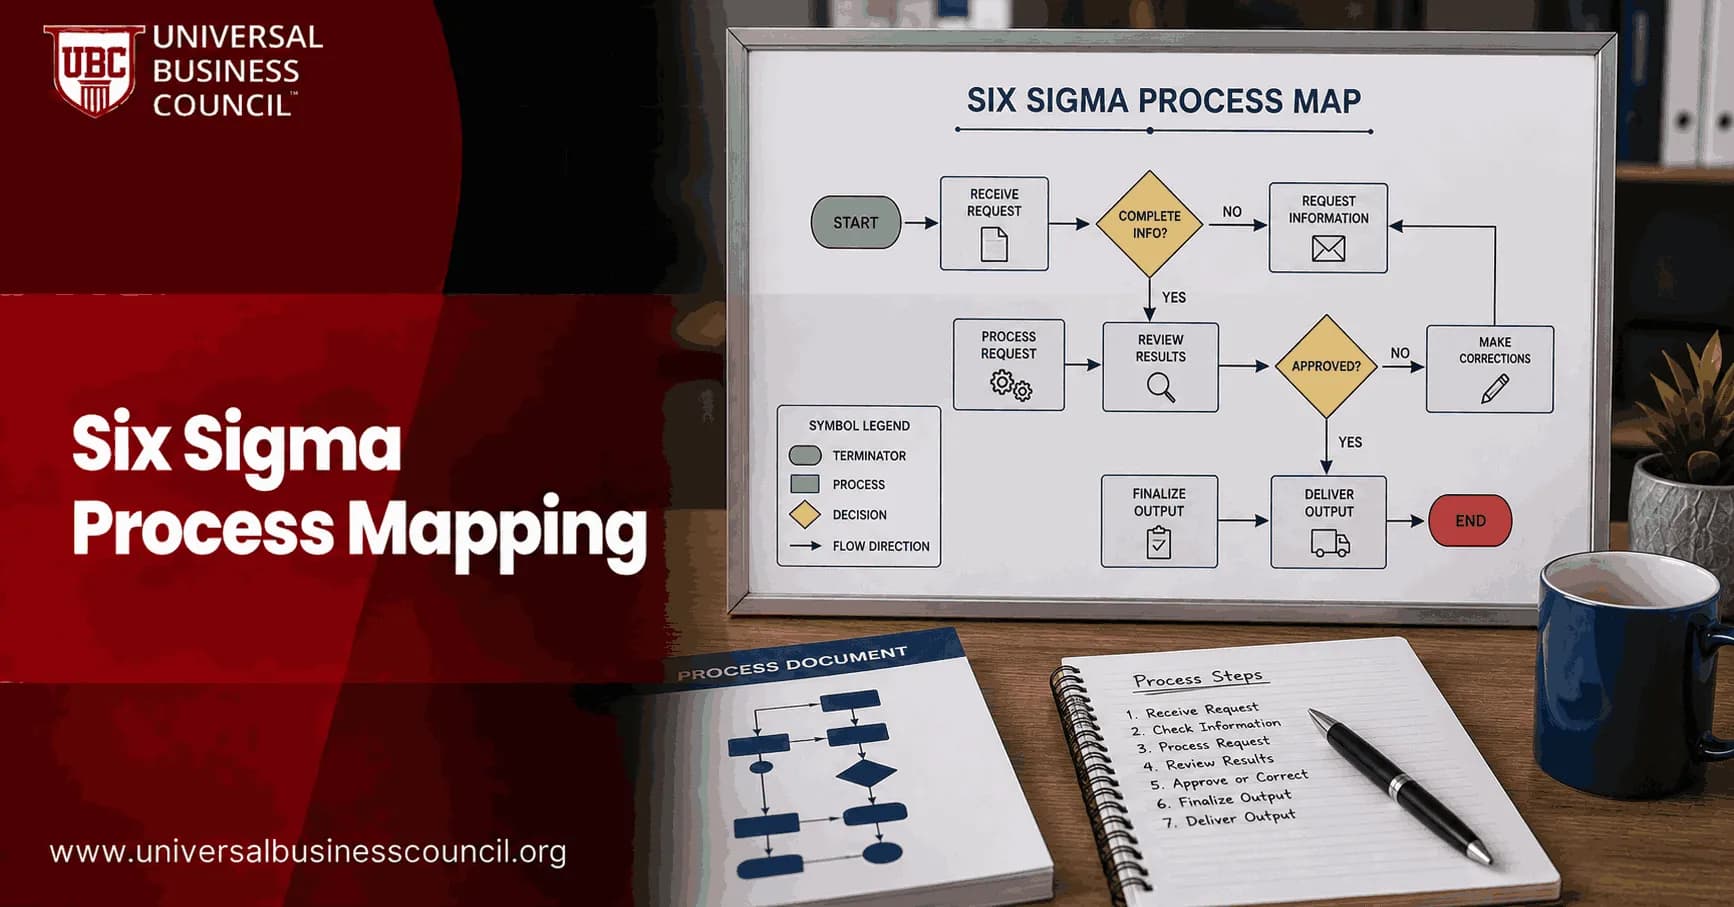
Six Sigma process mapping is the quickest way to see how work really moves through your organization. Not how the procedure says it moves. Not how the manager remembers it. The real flow: requests, approvals, queues, rework, data entry, handoffs, and exceptions. For professionals developing structured process improvement expertise, a Certified Six Sigma Expert pathway can provide a practical foundation for using process maps within DMAIC projects.
That distinction matters. In many DMAIC projects, the first useful finding is not statistical. It is visual. A team looks at a swimlane diagram and realizes that a three-minute task waits two days because it crosses a role boundary no one owns. I have watched service teams argue for weeks about system defects, then find the bigger issue on the wall: the same customer data was being typed into two different systems by two different teams.

What Is Six Sigma Process Mapping?
Six Sigma process mapping is a structured method for drawing the steps, inputs, outputs, decisions, and movements that make up a business process. Put simply, it is a pictorial view of how a process operates and a practical way to analyze each step and movement for value.
For professionals who want to combine process improvement with broader organizational and leadership capabilities, Management Certifications can complement this learning by developing skills useful for coordinating teams, managing workflows, and sustaining improvement initiatives.
In the DMAIC method, process maps usually appear early in Define and Measure. They help you set boundaries, identify stakeholders, and decide where to collect data. Later, in Analyze, Improve, and Control, the map becomes a working tool for root cause analysis, redesign, training, and standard work.
The mistake beginners make? They draw the process they wish existed. Do not do that. Walk the work. Ask the person doing the job. Check the system timestamps if you can.
Core Six Sigma Process Mapping Tools
SIPOC Diagram
A SIPOC diagram captures five elements: Suppliers, Inputs, Process, Outputs, and Customers. It is a high-level view, usually with 5 to 7 major process steps. Most Lean Six Sigma training places SIPOC in the Define phase because it prevents scope creep.
Use SIPOC when the team cannot agree where the process starts, where it ends, or who the customer is. It is the wrong tool if you need to diagnose every rework loop. Keep it high level.
Basic Flowchart
A basic flowchart shows the step-by-step sequence of work using standard symbols for tasks, decisions, and flow direction. It is simple, and that is its strength.
Use it for a single-team workflow, such as invoice review, password reset, or purchase request approval. If the process crosses departments, a plain flowchart can hide the real problem: handoffs.
Swimlane Diagram
A swimlane diagram separates process steps by role, department, or system. This is where uncomfortable truths show up. Sales waits on finance. Finance waits on operations. Operations waits on missing information from sales.
Swimlanes are especially useful in service, healthcare, IT, finance, and public sector processes where information moves more than physical materials.
Value Stream Map
Value stream mapping comes from Lean practice and is now a core Lean Six Sigma tool. It shows material flow, information flow, cycle time, queue time, inventory, and value-added versus non-value-added work.
Use value stream mapping when time, throughput, or waste is the main issue. It works well in manufacturing, but it also fits digital workflows. For example, a software support process may have ten minutes of actual analyst work and four days of waiting between priority checks.
How to Build a Useful Process Map
The rigorous version is the same across most Lean Six Sigma training: define the scope, list the steps, order them correctly, use clear notation, and validate the map with stakeholders. Here is the practical version.
Set the boundary. Name the start and end points. For example: from customer order received to order released for shipment.
Choose the map type. Start with SIPOC for scope. Move to swimlane or detailed mapping for diagnosis.
Collect the real steps. Include approvals, waiting, inspections, data entry, rework, and exception handling.
Map the sequence. Show decisions and alternate paths. If 20 percent of cases follow a different route, draw it.
Validate with the people doing the work. Front-line staff will spot missing workarounds faster than a project sponsor will.
Add data. Tag steps with cycle time, defect rate, queue length, touch time, or resource utilization.
One warning for certification candidates: SIPOC process boxes should not become detailed task lists. Keep them to 5 to 7 high-level steps. Detailed steps belong in a flowchart, swimlane diagram, or value stream map.
How Process Mapping Improves Workflows
A process map improves work because it makes waste visible. You can see where a customer request waits, where a defect enters, and where the organization adds controls that no longer reduce risk.
Shared understanding: Teams stop debating memory and start discussing the same visual model.
Waste removal: Waiting, rework, redundant approvals, movement, and duplicate entry become easier to challenge.
Root cause analysis: You can connect defects to exact steps, decision points, or handoffs.
Better measurement: The map shows where to collect useful data instead of measuring everything.
Standardization: The improved map becomes training material and part of the control plan.
To be blunt, process mapping is overhyped when teams stop at drawing. A polished diagram does not reduce defects. A map with data, ownership, and follow-up actions can.
Where Digital Tools and Process Mining Fit
Modern Six Sigma process mapping is becoming more data rich. Teams use collaborative whiteboards, workflow tools, and process mining platforms to compare the documented process with event logs from business systems. Celonis, for example, has helped popularize process mining as a way to reveal actual process paths and exceptions.
Still, do not skip the workshop. System data shows what happened. People explain why it happened. You need both.
When process mapping involves software platforms, automation, data pipelines, or interconnected systems, technical knowledge can also help teams understand why certain process paths or exceptions occur. Deep Tech Certification can provide complementary exposure to technology concepts that support this broader perspective.
Building Process Mapping Skills for Certification
If you are preparing for a Universal Business Council Six Sigma certification course, practice mapping a real process before you study templates. Pick a workflow you know: customer onboarding, lead qualification, procurement, incident response, or month-end reporting.
Then create three views:
A SIPOC to define scope and stakeholders.
A swimlane map to expose handoffs.
A value stream map to quantify waiting and value-added time.
This sequence mirrors how process mapping is used in real DMAIC work. It also connects directly to Universal Business Council learning paths in Six Sigma, Lean Six Sigma, process improvement, operations management, and quality management.
Next Step
Choose one process this week and map the current state with the people who perform the work. Keep the first version rough. Add cycle time and defect data only after the flow is accurate. If your goal is formal recognition, continue with a Universal Business Council Six Sigma certification course and use your map as the starting artifact for a DMAIC improvement project.
As process improvement becomes increasingly connected to digital platforms, analytics, automation, and enterprise systems, broader technology knowledge can also help professionals work effectively across operations and technical teams. A Tech Certification pathway can complement process mapping expertise with additional technology-focused learning.
FAQs
1. What is process mapping in Six Sigma?
Six Sigma process mapping is the practice of visually documenting how work moves through a process from start to finish. A process map shows activities, decisions, inputs, outputs, delays, handoffs, and responsibilities so teams can understand how the process actually operates.
A simple map might be:
Customer Order → Validate → Approve → Process → Ship → Confirm Delivery
Six Sigma teams use process maps to identify waste, bottlenecks, rework, variation, unnecessary steps, and potential root causes. Apparently drawing the process is sometimes what it takes to discover that nobody actually agrees on what the process is.
2. Why is process mapping important in Six Sigma?
Process mapping makes invisible workflows visible. It gives team members a shared picture of how work moves across people, systems, and departments.
It can help identify:
Bottlenecks
Delays
Rework loops
Excessive approvals
Duplicate activities
Unnecessary handoffs
Missing controls
Process variation
Unclear ownership
Non-value-added work
This creates a factual starting point for process measurement and improvement rather than relying entirely on procedures or institutional memory.
3. When is process mapping used in DMAIC?
Process mapping can support every phase of DMAIC.
Define: Establish process boundaries and scope.
Measure: Identify process steps and measurement points.
Analyze: Locate waste, bottlenecks, variation, and potential causes.
Improve: Redesign the workflow.
Control: Standardize and document the improved process.
It is particularly useful early in a DMAIC project because statistical analysis becomes rather adventurous when nobody has clearly defined the process being analyzed.
4. How do you create a Six Sigma process map?
A practical process-mapping approach is:
Step 1: Define the purpose of the map.
Step 2: Establish start and end points.
Step 3: Identify major process steps.
Step 4: Arrange steps in actual sequence.
Step 5: Add decision points.
Step 6: Include alternative paths and rework loops.
Step 7: Identify handoffs and responsibilities.
Step 8: Validate the map with frontline employees.
Step 9: Observe the actual process where possible.
Step 10: Analyze the map for improvement opportunities.
Start simple. Detail can be added where it helps answer the improvement question.
5. What symbols are commonly used in Six Sigma process maps?
Common flowchart-style process mapping symbols include:
Oval: Start or end.
Rectangle: Process activity.
Diamond: Decision.
Arrow: Direction of workflow.
Parallelogram: Input or output.
Connector: Connection between different parts of the map.
Specialized mapping methods may use additional symbols.
The purpose is communication, not graphic decoration. A process map requiring a three-page symbol legend has possibly wandered away from that objective.
6. What is a high-level process map?
A high-level process map shows the major stages of a process without documenting every detailed task.
For example:
Receive Order → Validate → Fulfill → Ship → Invoice
It is useful during the Define phase because it helps establish:
Process boundaries
Major activities
Key stakeholders
Major inputs and outputs
Once the high-level process is understood, teams can create detailed maps for areas requiring deeper investigation.
7. What is a detailed process map?
A detailed process map breaks major activities into individual tasks, decisions, handoffs, exceptions, and rework paths.
Instead of:
Validate Order
the map might show:
Check Customer Data
↓
Information Complete?
No → Contact Customer → Receive Information → Recheck
Yes → Verify Product Availability
Detailed maps are useful when teams need to understand exactly where defects, delays, or variation enter the workflow.
8. What is a current-state process map?
A current-state, or as-is, process map documents how work actually occurs today.
It should capture:
Actual activities
Real decision rules
Informal workarounds
Rework loops
Existing approvals
Delays
Handoffs
System interactions
The current-state map should not simply reproduce the official procedure.
If employees regularly bypass, modify, or supplement the documented workflow, those behaviors belong on the map because they are part of the actual process.
9. What is a future-state process map?
A future-state, or to-be, process map represents the improved workflow the organization intends to implement.
Teams might redesign the current process by:
Removing unnecessary activities
Combining steps
Automating repetitive tasks
Simplifying decisions
Reducing approvals
Eliminating rework
Reducing handoffs
Moving quality controls upstream
Standardizing work
The progression is:
Current State → Analyze Problems → Design Improvements → Future State
The future-state map should be realistic enough to implement, not merely a diagram in which all inconvenient rectangles mysteriously disappear.
10. What is a swimlane process map?
A swimlane map organizes activities into lanes according to the person, department, function, or system responsible for them.
For example:
Customer | Sales | Finance | Operations | Logistics
As work crosses between lanes, the map exposes handoffs.
This makes swimlane diagrams particularly useful for cross-functional processes where delays occur because work repeatedly moves between departments.
If a simple request crosses nine lanes before completion, the process has helpfully drawn its own warning sign.
11. What is the difference between process mapping and SIPOC?
A SIPOC diagram provides a high-level view of:
Suppliers → Inputs → Process → Outputs → Customers
A process map provides more detail about the activities and decisions inside the process.
For example:
SIPOC: Defines the overall process and its boundaries.
Process Map: Shows how the work actually moves through those boundaries.
A common sequence is:
SIPOC → High-Level Process Map → Detailed Process Map
This allows Six Sigma teams to move from broad scope to detailed analysis systematically.
12. What is the difference between process mapping and Value Stream Mapping?
A process map primarily shows workflow, activities, decisions, and handoffs.
A Value Stream Map (VSM) usually adds Lean information such as:
Cycle time
Waiting time
Inventory
Work-in-process
Information flow
Takt time
Uptime
Value-added time
Total lead time
Therefore:
Process Map → How does work move?
VSM → How does value flow, where does it wait, and where is waste concentrated?
VSM is particularly useful for end-to-end Lean flow improvement.
13. How can process mapping identify bottlenecks?
Process maps reveal locations where work repeatedly queues, waits, or slows.
For example:
Submit Request → Wait → Manager Approval → Wait → Processing
If large queues consistently form before approval, that stage may be a bottleneck.
Teams should then verify the suspected constraint using data such as:
Cycle time
Queue time
Capacity
Utilization
Throughput
Work-in-process
The map tells you where to investigate. The data determines whether the suspicious-looking rectangle actually deserves prosecution.
14. How does process mapping identify waste?
Teams can evaluate each mapped activity and ask:
Does the customer value this step?
Does it transform the product or service?
Is it required by regulation or business necessity?
Could it be eliminated, simplified, combined, or automated?
Common wastes revealed through process mapping include:
Waiting, rework, unnecessary movement, excessive approvals, duplicate entry, transportation, overprocessing, and unnecessary handoffs.
Steps can then be classified as value-added, necessary non-value-added, or non-value-added.
15. How can process mapping identify rework?
Rework often appears as a process loop.
For example:
Review Application
↓
Information Correct?
No → Return to Applicant → Correct Information → Resubmit → Review Again
This loop increases:
Lead time
Processing cost
Workload
Variation
Customer frustration
Teams can measure how frequently work enters the loop and investigate why errors are not prevented earlier.
Reducing rework is usually more effective than becoming extremely efficient at performing it.
16. How do process handoffs affect quality and cycle time?
A handoff occurs whenever work, responsibility, material, or information transfers between people, departments, systems, or organizations.
Each handoff can introduce:
Waiting
Communication errors
Lost information
Duplicate work
Data-entry errors
Unclear ownership
For example:
Sales → Finance → Operations → Warehouse → Logistics
A process map makes these transitions visible, allowing teams to determine whether some handoffs can be removed, simplified, automated, or better standardized.
17. How does process mapping support root cause analysis?
Process maps provide context for understanding where defects or delays enter the process.
Suppose defects are detected at final inspection. The map can help the team trace backward through:
Inspection ← Assembly ← Processing ← Setup ← Incoming Material
Potential causes can then be investigated using:
Fishbone diagrams
5 Whys
Pareto analysis
FMEA
Scatter diagrams
Hypothesis testing
Regression
Process mapping narrows the investigation, but it does not independently prove root cause.
18. What is a practical Six Sigma process mapping example?
Consider an invoice-approval process:
Process Step | Processing Time | Waiting Time |
|---|---|---|
Receive invoice | 5 min | 2 hrs |
Validate invoice | 10 min | 5 hrs |
Manager approval | 5 min | 18 hrs |
Enter payment | 10 min | 3 hrs |
Release payment | 5 min | 4 hrs |
Total processing time:
35 minutes
Total waiting time:
32 hours
The map immediately suggests that reducing data-entry time from ten minutes to eight is unlikely to transform performance.
The much larger opportunity lies in the 32 hours of waiting, particularly around approval.
19. What are common process mapping mistakes in Six Sigma?
Common mistakes include:
Mapping the documented process instead of the actual process.
Starting with too much detail.
Ignoring exceptions and rework loops.
Failing to involve frontline employees.
Leaving out decision criteria.
Ignoring handoffs and waiting.
Assuming every mapped activity is necessary.
Treating the process map as proof of root cause.
Never updating the map after improvements.
The map should represent reality closely enough to support decisions. A beautiful diagram of an imaginary process is mostly corporate illustration.
20. How should Six Sigma teams use process mapping to improve workflows?
An effective process-mapping improvement cycle is:
Define Process Scope
↓
Identify Customers and Requirements
↓
Map the Current State
↓
Validate the Map at the Actual Process
↓
Identify Decisions and Handoffs
↓
Measure Processing and Waiting Times
↓
Highlight Defects and Rework
↓
Identify Bottlenecks and Waste
↓
Analyze Root Causes
↓
Eliminate Unnecessary Activities
↓
Simplify and Standardize Remaining Work
↓
Design the Future-State Process
↓
Pilot Improvements
↓
Measure Results
↓
Implement Controls
↓
Maintain Updated Process Documentation
The important progression is:
Visualize → Measure → Analyze → Improve → Control
Process mapping works because many performance problems are difficult to understand when they are scattered across departments, systems, emails, procedures, and individual habits.
Putting the workflow on one map exposes the structure of the problem.
A process that appears simple when described as “approve the request” may turn out to contain four systems, six approvals, eleven handoffs, two rework loops, and a mysterious spreadsheet maintained by someone named Kevin.
At that point, at least the Six Sigma team knows what it is dealing with.
Related Articles
View All
Six Sigma
Six Sigma Process Standardization: Creating Consistent Workflows
Learn how Six Sigma process standardization uses standard work, DPMO, audits, and digital work instructions to create consistent workflows.
Six Sigma
Six Sigma vs Process Improvement: Is Six Sigma the Same Thing?
Six Sigma is a structured process improvement method, not a synonym for process improvement. Learn when to use Six Sigma, Lean, Kaizen, or simpler workflow fixes.
Six Sigma
Six Sigma vs Business Process Management: How They Work Together
Learn how Six Sigma and Business Process Management work together to reduce variation, improve workflows, and sustain process performance.
Trending Articles
The Role of Blockchain in Ethical AI Development
How blockchain technology is being used to promote transparency and accountability in artificial intelligence systems.
AWS Career Roadmap
A step-by-step guide to building a successful career in Amazon Web Services cloud computing.
Top 5 DeFi Platforms
Explore the leading decentralized finance platforms and what makes each one unique in the evolving DeFi landscape.