

Six Sigma Software and Tools: What Teams Need to Succeed
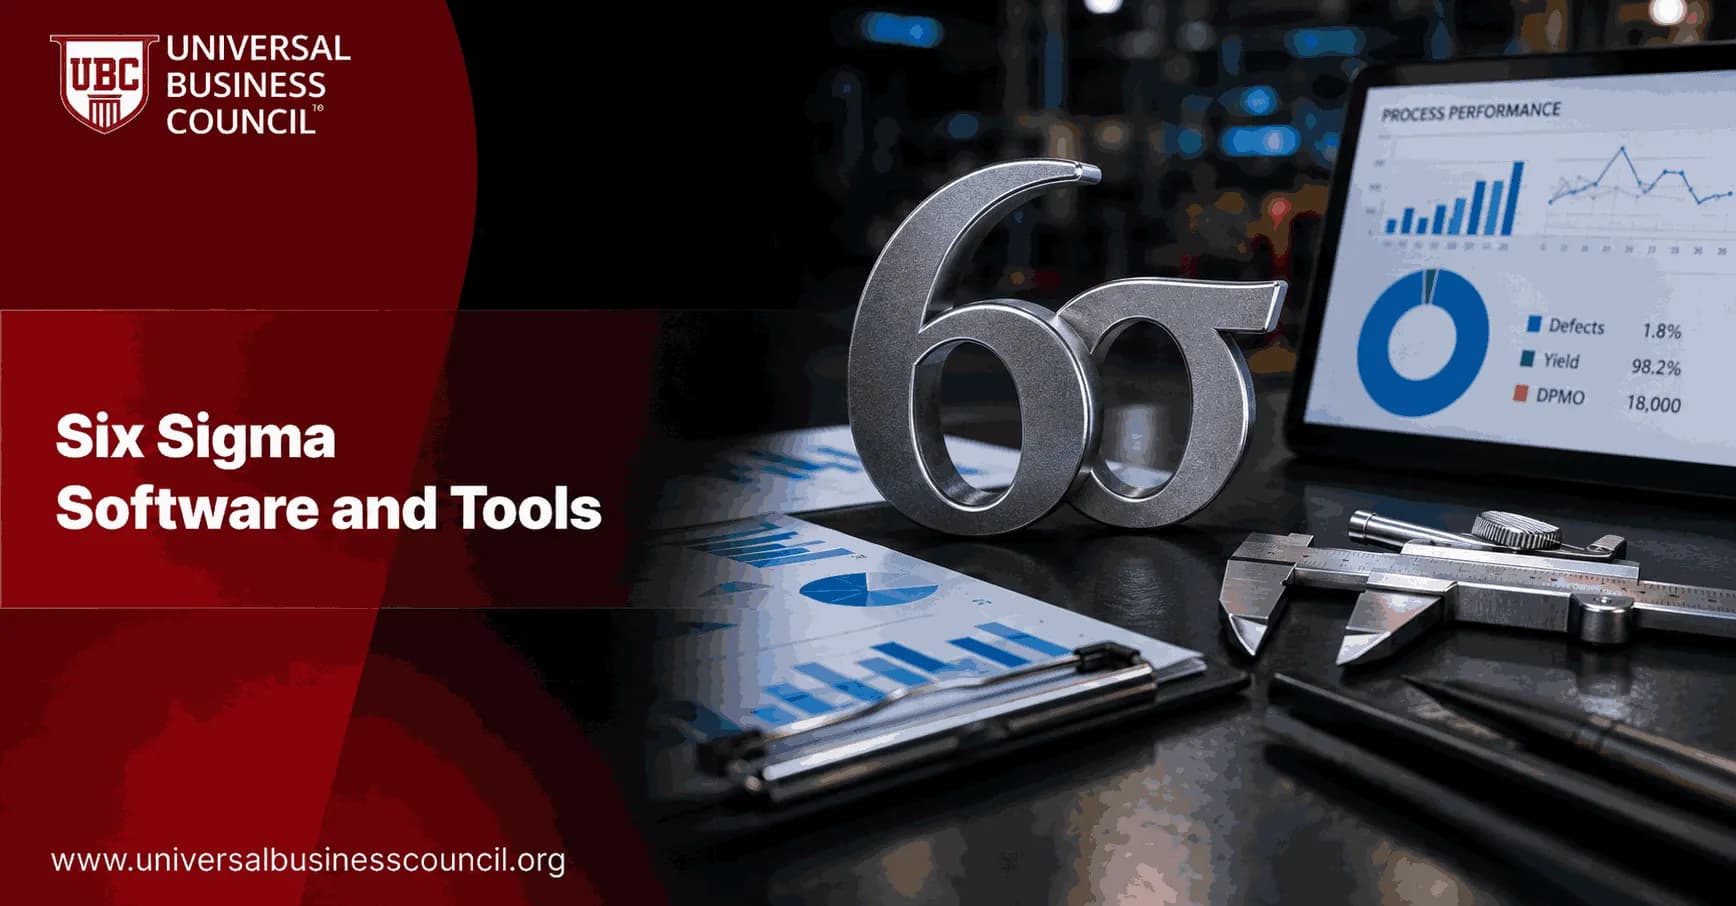
Six Sigma software and tools now sit at the center of serious process improvement work. A Green Belt can still sketch a SIPOC on a whiteboard, and sometimes should, but teams that want repeatable gains need clean data, statistical analysis, workflow control, and visible project governance. Professionals who want to lead this kind of work rather than just operate the tools often start with the Certified Six Sigma Expert credential, which covers the DMAIC discipline this article is built around.
The mistake I see most often is simple. Teams buy a statistics package, call it the system, then wonder why projects stall after the Analyze phase. The software is not the method. It is the working environment around DMAIC, and it has to support Define, Measure, Analyze, Improve, and Control without forcing people back into scattered spreadsheets.

What Six Sigma Software Needs to Do
Modern Six Sigma software has moved far beyond desktop charting. The strongest toolsets combine statistical analysis, process modeling, mobile data collection, collaboration, and executive dashboards. That matters because most failures are not caused by one bad calculation. They come from weak project selection, poor measurement plans, missing owners, and control plans nobody checks after the project closes. Because building this kind of environment touches tool selection, training, and governance across many teams, deployment leaders often pair Six Sigma work with broader Management Certifications, since standardizing tools and practice across an organization is a leadership skill in its own right.
At minimum, your team needs tools that support five jobs:
Collect reliable data from shop floor, service, finance, healthcare, or software workflows.
Analyze variation using control charts, capability analysis, regression, hypothesis tests, and design of experiments.
Map the process with SIPOC diagrams, value stream maps, swimlanes, and future state flows.
Manage the project portfolio with charters, benefit tracking, tollgate reviews, and control plans.
Train and coordinate people across sites, functions, and skill levels.
That stack looks different in a hospital than in a precision machining cell. Still, the logic holds: better inputs, better analysis, better decisions.
Core Categories of Six Sigma Tools
Statistical analysis tools
This is the classic Six Sigma layer. Minitab, JMP, SigmaXL, Statgraphics, NCSS, and R are common choices for teams doing capability studies, Pareto analysis, ANOVA, regression, control charts, and design of experiments.
Use these when you need to answer questions like: Is the process stable? Is supplier A really different from supplier B? Did the change reduce defect rate, or did we just get a lucky week?
One practical warning: do not let the chart drive the project. I have seen teams run a beautiful two-sample t-test on data that came from three operators using different definitions of a defect. The p-value was tidy. The measurement system was not. Start with operational definitions and measurement system analysis before you trust the output.
Process mapping and modeling tools
Process tools help teams see work as it actually flows, not as the procedure manual says it flows. Microsoft Visio is still widely used for simple maps. Larger organizations may run ARIS, QPR ProcessGuide, or a similar business process management platform.
For complex operations, simulation is worth the effort. Tools such as MoreSteam's Process Playground are used in Lean Six Sigma work to test bottlenecks and variation before changing the real process. The point is not a spreadsheet trick. It is the value of testing capacity, queues, downtime, staffing, and variation before spending money.
Program and project management tools
Six Sigma succeeds or fails in the portfolio. A single Black Belt project may deliver savings, but enterprise improvement needs a way to rank opportunities, assign sponsors, track benefits, and see which control plans are drifting.
Good project management tools should include:
Project charters tied to business goals and CTQs
DMAIC tollgate status
Financial benefit validation
Risk and action logs
Dashboards for sponsors and deployment leaders
Standard templates for control plans and handoffs
Leadership usually cares less about the histogram than the committed benefit, project cycle time, and whether the fix stayed fixed after 90 days. Build dashboards around those questions.
Data collection and real-time monitoring
Manual data entry is where many Six Sigma projects quietly lose credibility. Mobile inspection apps, web forms, machine feeds, sensor data, and transactional system exports can cut delay and reduce transcription errors.
Real-time data collection is especially useful in manufacturing, logistics, healthcare, and field service. It lets teams spot drift early, attach evidence such as photos, and trigger corrective action before defects pile up. In DMAIC terms, it strengthens Measure and Control, which are the two phases teams most often under-resource. As more of this monitoring shifts onto sensor feeds, mobile apps, and connected systems, some deployment teams pair this work with a Deep Tech Certification to build a stronger footing in the emerging technology now generating this real-time data.
Engineering and design tools
For product and engineering teams, Six Sigma tools must move upstream. Tolerance analysis software such as Sigmetrix CETOL 6 Sigma integrates with CAD environments including PTC Creo, CATIA V5, and SOLIDWORKS. That lets teams model geometric variation before parts reach production.
This matters in Design for Six Sigma because late defect removal is expensive. If a tolerance stack creates assembly failures, no dashboard will save the launch. You need variation analysis before tooling, supplier contracts, and validation testing lock in the design.
Evidence from Real Six Sigma Deployments
The business case for Six Sigma software and tools is strongest when paired with disciplined methods. Motorola, which originated the method in the 1980s, has reported billions of dollars in savings and steep defect reductions across the first years of its deployment. General Electric, under Jack Welch, treated Six Sigma as a company-wide priority through the late 1990s and credited it with substantial quality and cost gains.
Across industries the mechanism repeats. Software teams have cut defect rates and rework. Financial services projects have shortened account opening and processing times. Healthcare teams have reduced medication errors after standardizing protocols and using data analysis.
Do not read those results as plug-and-play benchmarks. Context matters. A messy claims process and a CNC machining line need different tools. But the mechanism is consistent: collect better data, analyze variation, improve the process, then monitor the new standard.
How to Choose the Right Six Sigma Tool Stack
Use this selection order. It prevents overbuying.
Start with the project type. Manufacturing variation needs statistical and measurement tools. Service delays need workflow data and process mapping. Engineering defects may need tolerance analysis.
Check integration. If data must be copied from Salesforce, ERP, EHR, MES, or Jira by hand every week, adoption will fall.
Match tools to skill level. R is powerful, but not every Green Belt wants to maintain scripts. Minitab or JMP may be better for guided analysis.
Standardize templates. Charters, fishbone diagrams, FMEA, control plans, and benefit sheets should look the same across the organization.
Train the team. Software training without Six Sigma training creates button-clickers. Six Sigma training without software practice creates theory-heavy projects.
If you are developing internal capability, connect tool training to the relevant Universal Business Council Six Sigma, quality management, project management, and business analytics certification programmes. That gives learners a path from method knowledge to applied project execution.
Common Mistakes to Avoid
Buying one tool for every problem. No single platform covers all statistical, workflow, engineering, and training needs equally well.
Skipping measurement system analysis. Bad measurement ruins good software.
Tracking savings too loosely. Finance should validate benefits, not simply accept project team estimates.
Letting dashboards replace gemba work. Walk the process. The screen will not show every workaround.
Ending at Improve. Control plans, ownership, and monitoring are where gains become permanent.
The Practical Next Step
Choose one active improvement project and map its DMAIC tool needs this week. List the data source, analysis method, process map, project dashboard, and control metric. If any box is blank, fix that before buying another platform. Then build practitioner skill through a structured Six Sigma certification path, ideally one that requires you to apply the tools to a real business problem. If your own role also touches the integrations, data feeds, or platforms behind that tool stack, a general Tech Certification can help round out that technical side of the work.
FAQs
1. What are Six Sigma software and tools?
Six Sigma software and tools are applications, templates, and analytical techniques that help teams measure process performance, identify defects, analyze variation, determine root causes, implement improvements, and sustain results. Common software includes Minitab, JMP, Excel, SigmaXL, R, Python, and business intelligence platforms. Teams also use Six Sigma tools such as process maps, Pareto charts, control charts, fishbone diagrams, FMEA, and Design of Experiments. The right combination depends on project complexity, data requirements, team skills, and industry needs.
2. What software is commonly used for Six Sigma projects?
Popular software used for Six Sigma includes Minitab, JMP, Microsoft Excel, SigmaXL, R, and Python. Minitab is widely associated with statistical quality analysis, while JMP offers interactive visualization and advanced analytics. SigmaXL extends Excel with additional statistical tools, and Excel remains useful for everyday analysis and reporting. R and Python provide extensive flexibility for technically skilled teams. Organizations may also use project management, process mapping, business intelligence, and statistical process control software alongside these platforms.
3. What are the most important Six Sigma tools for process improvement?
Important Six Sigma tools include SIPOC diagrams, process maps, Pareto charts, fishbone diagrams, the 5 Whys, control charts, process capability analysis, Measurement System Analysis (MSA), Failure Mode and Effects Analysis (FMEA), hypothesis testing, regression analysis, and Design of Experiments (DOE). Different tools answer different questions during DMAIC. Teams should choose tools according to the problem and available data rather than forcing every project through an enormous collection of charts because someone paid for the software license.
4. How does Six Sigma software support DMAIC projects?
Six Sigma software can support all five DMAIC phases: Define, Measure, Analyze, Improve, and Control. Teams may use project management and mapping tools during Define, statistical software during Measure and Analyze, experimental and optimization tools during Improve, and dashboards or control charts during Control. Software can automate calculations, visualize process behavior, and organize project information. However, DMAIC remains a problem-solving methodology, so software should support structured thinking rather than become the project itself.
5. Which Six Sigma software is best for beginners?
Excel and user-friendly statistical platforms such as Minitab or SigmaXL can be suitable for Six Sigma beginners, depending on the required analysis and available training. Excel is familiar to many users and useful for basic calculations, Pareto charts, dashboards, and data organization. Minitab provides more specialized statistical workflows through a graphical interface. Beginners should prioritize learning DMAIC, process variation, data types, and basic statistics alongside software because knowing which button to press is considerably less useful than knowing why it should be pressed.
6. Is Minitab necessary for Six Sigma?
No. Minitab is not mandatory for implementing Six Sigma, although it is widely used because it provides many statistical and quality tools in one environment. Six Sigma projects can also be completed using JMP, SigmaXL, Excel, R, Python, or other appropriate analytical platforms. The important requirement is the ability to collect reliable data, perform suitable analysis, interpret results correctly, and monitor improvements. Software choice should reflect project requirements, team capabilities, budget, and organizational standards.
7. Can Excel be used as a Six Sigma tool?
Yes. Excel can support data collection, descriptive statistics, PivotTables, Pareto analysis, histograms, scatter plots, dashboards, and basic process calculations. Teams can also create DMAIC trackers, FMEA worksheets, control plans, and project templates in Excel. Additional statistical functionality is available through built-in features and third-party add-ins. For advanced analyses such as complex DOE, specialized control charts, or detailed Measurement System Analysis, dedicated statistical software may provide a more efficient and controlled environment.
8. What tools are used in the Define phase of Six Sigma?
Common Define-phase tools include the project charter, SIPOC diagram, Voice of the Customer analysis, Critical-to-Quality requirements, stakeholder analysis, high-level process maps, and problem statements. These tools help teams clarify the business problem, project scope, customer expectations, objectives, and process boundaries. Project management and process mapping software can make collaboration easier, but the most important outcome is a clearly defined problem that is measurable and significant enough to justify an improvement project.
9. What tools are used in the Measure phase of Six Sigma?
Measure-phase tools commonly include data collection plans, operational definitions, process maps, descriptive statistics, Measurement System Analysis, Gage R&R, baseline control charts, capability analysis, and performance dashboards. These tools establish how the process currently performs and whether the measurement system is reliable enough for analysis. Statistical software can automate many calculations, but teams must still ensure that the collected data accurately represents the process and the problem being investigated.
10. What tools are used in the Analyze phase of Six Sigma?
Analyze-phase tools include Pareto charts, fishbone diagrams, the 5 Whys, hypothesis testing, regression analysis, correlation analysis, ANOVA, scatter plots, and detailed process analysis. The objective is to move from suspected causes to evidence-supported root causes. Statistical software can help test relationships and compare groups, while process knowledge provides essential context. Teams should avoid confusing correlation with causation, which remains an impressively durable human tradition despite several centuries of statistical warnings.
11. What tools are used in the Improve phase of Six Sigma?
Improve-phase tools include Design of Experiments, solution selection matrices, pilot testing, mistake-proofing or poka-yoke, process redesign, optimization methods, and risk analysis. Statistical software can help evaluate experimental results and determine which process settings improve performance. Teams should test proposed solutions before full implementation whenever practical. Improvements should address validated root causes and demonstrate measurable benefits rather than simply introducing new technology or procedures because they appear more modern.
12. What tools are used in the Control phase of Six Sigma?
Control-phase tools include Statistical Process Control charts, control plans, dashboards, standard operating procedures, response plans, process audits, visual management, and ongoing KPI monitoring. These tools help teams verify that improved processes remain stable and continue meeting requirements. Software can automate data collection, reporting, and alerts when performance changes. Effective controls should also define who owns the process and what action must be taken when performance begins moving outside expected conditions.
13. What is the best software for Six Sigma statistical analysis?
The best software depends on the organization's analytical needs and user skills. Minitab is popular for structured quality and statistical analysis, JMP is strong in interactive exploration and experimental design, and SigmaXL provides statistical tools within Excel. R and Python offer extensive flexibility, automation, and advanced analytics for users with programming skills. Organizations should compare statistical functionality, usability, integrations, reporting, licensing costs, technical support, security, and training requirements before selecting a platform.
14. What software can teams use for Six Sigma process mapping?
Teams can use general diagramming, flowcharting, business process management, and collaboration software to create SIPOC diagrams, flowcharts, swimlane maps, and value stream maps. Spreadsheet and presentation applications can also support simpler process maps. The best tool depends on process complexity, collaboration needs, version control, and integration requirements. Process maps should make workflows and handoffs easier to understand. A diagram containing hundreds of tiny boxes connected by crossing arrows has technically mapped the process while successfully explaining almost nothing.
15. What software is useful for Six Sigma dashboards and KPI tracking?
Excel and business intelligence platforms such as Microsoft Power BI and Tableau are commonly used to create dashboards for Six Sigma projects. Dashboards can track defect rates, DPMO, first-pass yield, cycle time, process capability, Cost of Poor Quality, customer complaints, and other project-specific KPIs. Statistical platforms may also provide reporting and visualization capabilities. Effective dashboards should focus on measures connected to business and customer outcomes and allow teams to detect meaningful changes quickly.
16. How can AI tools support Six Sigma projects?
AI tools can support Six Sigma by analyzing large datasets, detecting anomalies, identifying patterns, predicting defects, classifying quality problems, and automating repetitive analytical tasks. Machine learning can complement traditional regression, statistical testing, and process monitoring when relationships are complex. Generative AI can also assist with documentation and information synthesis, subject to appropriate controls. AI outputs should be validated against reliable data and process expertise, particularly when decisions affect safety, compliance, customers, or significant financial outcomes.
17. What features should teams look for in Six Sigma software?
Useful features include descriptive statistics, hypothesis testing, control charts, capability analysis, Measurement System Analysis, regression, ANOVA, DOE, data visualization, reporting, and data-import capabilities. Depending on the organization, automation, database connectivity, collaboration, audit trails, security, access controls, and integration with enterprise systems may also matter. Teams should evaluate software using real project requirements rather than selecting the platform with the longest feature list, since unused functionality remains impressively expensive functionality.
18. How should a company choose the right Six Sigma tools?
Companies should begin by defining their improvement objectives, typical project complexity, data sources, statistical requirements, team capabilities, and regulatory obligations. They can then compare tools based on functionality, usability, scalability, integration, training, support, governance, and total cost of ownership. Running a pilot with representative projects can reveal whether a tool works effectively in practice. Standardizing a manageable set of approved tools can also make training, collaboration, and project governance easier across the organization.
19. What are the risks of relying too heavily on Six Sigma software?
The biggest risk is treating software output as automatically correct. Poor data, incorrect statistical assumptions, inappropriate tests, weak measurement systems, and misunderstood process context can all produce misleading results. Automation can make these mistakes happen faster and at greater scale. Six Sigma teams therefore need statistical knowledge, process expertise, data governance, and independent validation where appropriate. Software should make analysis easier, but it cannot determine whether the original business question was sensible or whether the resulting conclusion is operationally valid.
20. What Six Sigma software and tools do teams really need to succeed?
Most teams need a practical combination of process mapping, project management, data analysis, statistical analysis, and performance monitoring tools. A typical toolkit might include Excel for everyday data work, specialized statistical software such as Minitab or JMP for advanced analysis, visualization software for dashboards, and collaboration tools for project execution. More advanced teams may add R, Python, AI, process mining, or automated SPC platforms. Success ultimately depends less on owning every available tool and more on using a suitable set consistently within a disciplined DMAIC process.
Related Articles
View All
Six Sigma
Six Sigma Statistical Software: Comparing Popular Quality Tools
Compare Six Sigma statistical software including Minitab, JMP, SigmaXL, EngineRoom, cloud platforms, and SPSS for DMAIC, DOE, MSA, and quality projects.
Six Sigma
Six Sigma vs Project Management: Methods, Tools, and Career Paths
Compare Six Sigma vs Project Management across methods, tools, salaries, and career paths. Learn when to use DMAIC, Agile, Waterfall, or both.

Six Sigma
Six Sigma in Software Development: Reducing Defects and Rework
Learn how Six Sigma in software development reduces defects, rework, cycle time, and cost of poor quality through DMAIC, Lean methods, and metrics.
Trending Articles
The Role of Blockchain in Ethical AI Development
How blockchain technology is being used to promote transparency and accountability in artificial intelligence systems.
AWS Career Roadmap
A step-by-step guide to building a successful career in Amazon Web Services cloud computing.
Top 5 DeFi Platforms
Explore the leading decentralized finance platforms and what makes each one unique in the evolving DeFi landscape.