

Six Sigma Statistical Software: Comparing Popular Quality Tools
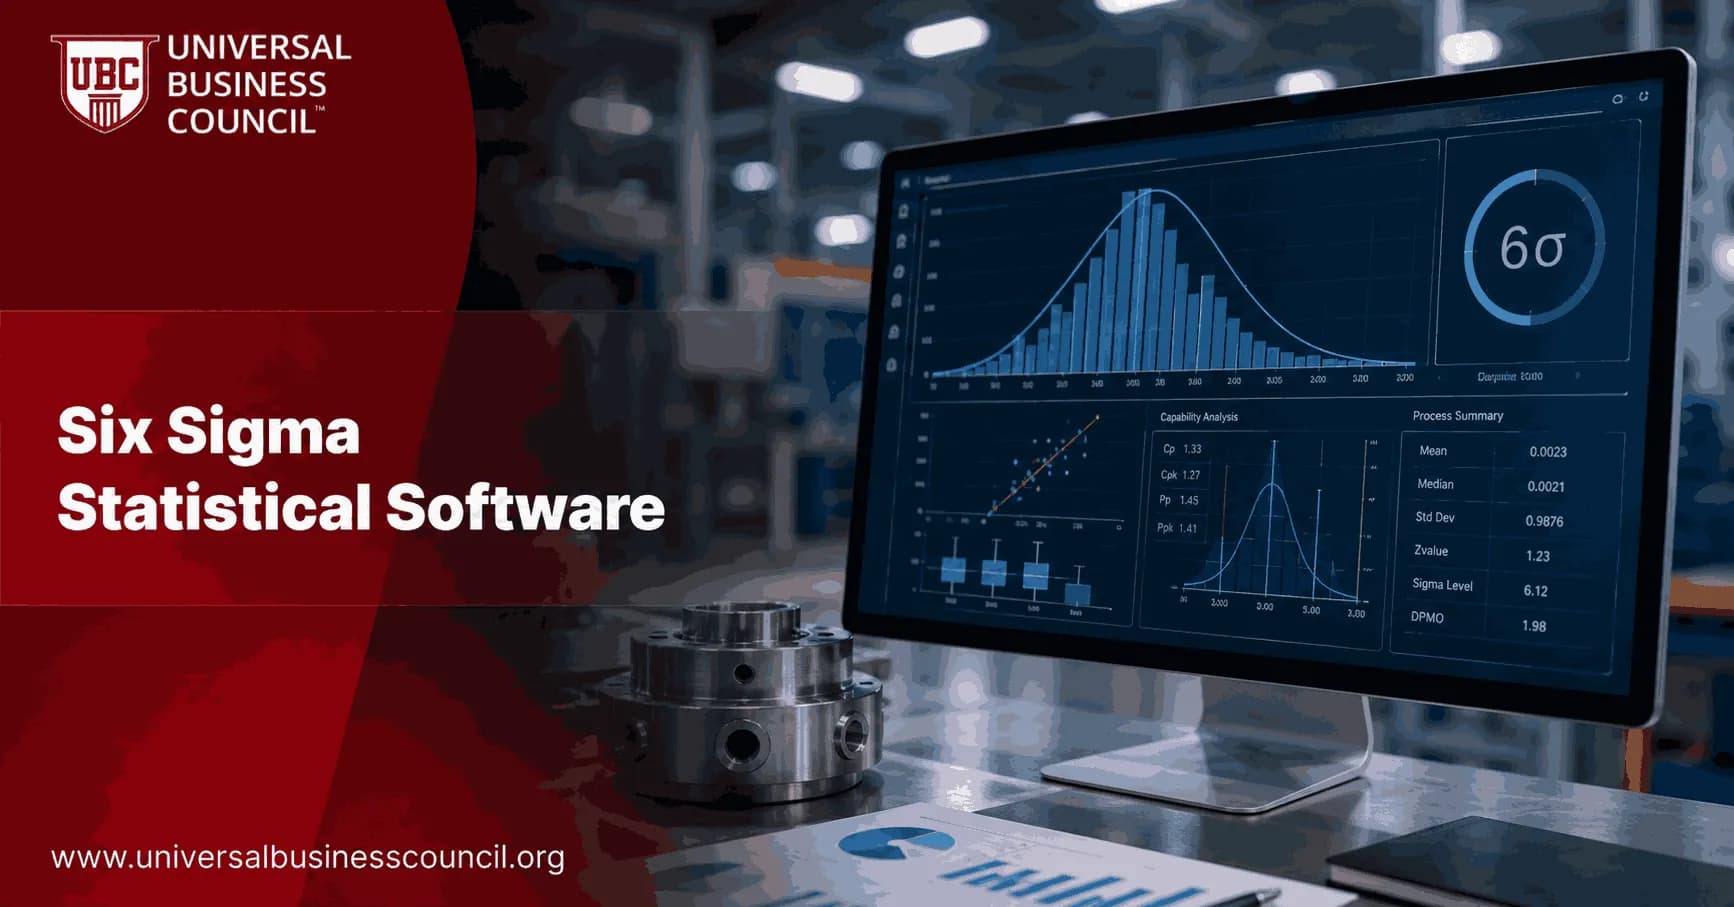
Six Sigma statistical software is no longer just a control chart generator. The serious tools now combine hypothesis testing, design of experiments, measurement system analysis, dashboards, and project workflow. Pick the wrong one and your Green Belt team may spend more time fixing spreadsheets than reducing variation. Pick the right one and DMAIC work gets faster, cleaner, and easier to defend in a review meeting. Professionals who want to run this kind of analysis with real statistical grounding, rather than just clicking through templates, often start with the Certified Six Sigma Expert credential, which covers the DMAIC discipline this software is meant to support.
What Six Sigma Statistical Software Must Do Well
Before comparing brands, be clear about the work. A good Six Sigma platform should support the practical rhythm of DMAIC: define the defect, measure the process, analyze causes, improve the method, and control the result. Because rolling out a standard tool across plants or business units is as much a change management exercise as a technology decision, quality leaders often pair software selection with broader Management Certifications, since driving adoption across that many teams is a leadership skill in its own right.

At minimum, you need:
Control charts for process stability and special cause variation.
Histograms and distribution plots for spread, skew, and outliers.
Pareto charts to separate the vital few from the trivial many.
Cause-and-effect diagrams, 5 Whys, and CTQ trees for structured root cause work.
Capability analysis, including Cp, Cpk, Pp, and Ppk.
Hypothesis tests, ANOVA, regression, and nonparametric methods.
Measurement system analysis, especially gage R&R.
Design of experiments for testing multiple factors without wasting trials.
Here is the blunt part. If your measurement system is weak, better software will not save the project. I have watched teams run a clean two-sample t-test on operator data, then discover the gauge rounded to a wider interval than the tolerance band could support. The chart looked professional. The conclusion was still useless.
Popular Six Sigma Quality Tools Compared
Minitab
Minitab remains the default choice in many manufacturing, healthcare, and operations teams. Its strengths sit in regression, DOE, control charts, capability analysis, and guided workflows such as the Assistant menu. That matters for mixed teams where not everyone is a statistician.
Best fit: Green Belt and Black Belt projects that need standard statistical depth, clear output, and audit-friendly reports.
Watch out: Licensing and training costs can grow when you roll it out across many plants or service centers.
JMP by SAS
SAS positions JMP as an interactive statistical discovery tool, and that description is fair. It is strong when you need to explore data visually, test models, and understand factor relationships quickly. JMP earns its keep on complex experiments and data-rich engineering work.
Best fit: Advanced users, R&D teams, process engineers, and analysts who want visual modeling rather than step-by-step templates.
Watch out: New users can get lost. JMP rewards statistical maturity.
SigmaXL
SigmaXL is an Excel add-in, which is both its attraction and its constraint. Many teams already live in Excel, so adoption feels natural. Its Six Sigma coverage is genuinely broad: graphical tool guides, control chart selection help, nonparametric tests, general linear models, MSA templates, response surface designs, screening designs, and two-level factorial designs.
Best fit: Teams that want practical Six Sigma analytics inside a familiar spreadsheet environment.
Watch out: Excel comfort can create false confidence. Users still need to understand sampling, independence, power, and assumptions.
EngineRoom by MoreSteam
EngineRoom is built around Lean Six Sigma training, project execution, and statistical analysis in a web-based environment. It is useful when the organization wants learning, coaching, and project tracking close to the data analysis work.
Best fit: Distributed improvement teams, certification cohorts, and organizations standardizing DMAIC project templates.
Watch out: Cloud deployment requires clear decisions on data access, retention, and IT governance.
IBM SPSS Statistics
IBM SPSS Statistics is not a Six Sigma-only product, but it supports regression, hypothesis testing, modeling, and data preparation work that can serve complex improvement projects. It often makes sense in larger enterprises already using IBM analytics or data governance tools.
Best fit: Data-heavy organizations with broader analytics needs beyond quality improvement.
Watch out: It may be more software than a basic DMAIC team needs.
Cloud, AI, and Enterprise Quality Trends
Recent Lean Six Sigma software reviews point to a clear shift toward cloud-based platforms. The reason is not fashion. Multi-site teams need shared dashboards, project visibility, version control, and access from plants, offices, and remote locations.
Market analyses also report strong growth in process improvement software and services, driven by technology-led execution: process mining, automated alerts, workflow tracking, and AI-assisted analysis. Treat headline market figures as directional rather than precise, since methods and scopes differ across reports.
Be careful with AI claims. AI can suggest chart types or flag unusual patterns, but it cannot define CTQs with your customer, validate a gauge, or decide whether a statistically significant result is worth changing a production standard. You still need judgment. Analysts who want to understand the technology stack behind process mining and AI-assisted analysis, rather than just consume the output, often build that footing with a Deep Tech Certification, which covers the emerging-technology fundamentals sitting behind these cloud quality platforms.
How to Choose the Right Six Sigma Statistical Software
Use this practical filter before you buy or standardize:
Match the tool to user skill. Minitab and SigmaXL suit many Green Belt teams. JMP suits stronger analysts.
Check DOE needs. If experiments are expensive, choose a tool with strong screening, fractional factorial, response surface, and power features.
Test MSA support. Regulated and high-risk processes need dependable gage R&R and measurement templates.
Review governance. Cloud tools need security, access control, data lineage, and compliance review.
Look at project management. If leaders track savings, cycle time, defect reduction, and project tollgates, standalone statistics may not be enough.
Training and Certification Context
Software skill is only one part of Six Sigma competence. If you are preparing for a Universal Business Council Six Sigma certification pathway, use the software to practice the thinking behind the method, not just the button clicks. Candidates often struggle with choosing the correct test: paired t-test versus two-sample t-test, ANOVA versus regression, stability versus capability. Practice those decisions until they feel routine.
It also helps to connect this work with related Universal Business Council training in quality management, process improvement, data analytics, and project management.
Final Recommendation
For most operational teams, start with Minitab or SigmaXL. Choose JMP when visual exploration and advanced modeling are central. Use EngineRoom or a cloud Lean Six Sigma platform when training, collaboration, and portfolio control matter as much as statistics. Next step: take one recent DMAIC project, rerun the analysis in your shortlisted tool, and compare speed, errors, and clarity of the final decision. If your own role also involves evaluating the IT infrastructure or data pipelines behind these platforms, a general Tech Certification can help round out that technical side of the work.
FAQs
1. What is Six Sigma statistical software?
Six Sigma statistical software is a category of analytical tools used to measure process performance, identify variation, investigate root causes, and validate process improvements. These applications can support techniques such as control charts, hypothesis testing, regression analysis, process capability analysis, Measurement System Analysis (MSA), Design of Experiments (DOE), and statistical modeling. Popular options include Minitab, JMP, SigmaXL, Excel-based solutions, and programming environments such as R and Python. The best choice depends on analytical complexity, budget, user skills, and organizational requirements.
2. What is the best statistical software for Six Sigma?
There is no single best Six Sigma statistical software for every organization. Minitab is widely associated with Six Sigma because of its extensive quality tools and relatively accessible interface. JMP offers strong interactive visualization and advanced statistical analysis, while SigmaXL provides Six Sigma-oriented functionality within Microsoft Excel. R and Python provide highly flexible analytical capabilities but generally require programming knowledge. The best software depends on the team's experience, required analyses, data volume, integration needs, budget, and reporting requirements.
3. Why is Minitab commonly used for Six Sigma?
Minitab is commonly used in Six Sigma because it provides many statistical and quality tools required for DMAIC projects in a structured interface. Users can perform process capability studies, control chart analysis, hypothesis testing, regression, ANOVA, Measurement System Analysis, and Design of Experiments. It is frequently used in manufacturing and quality-management environments and is also common in Six Sigma training. Its interface makes sophisticated statistical techniques more accessible to practitioners who do not want every analysis to become a programming project.
4. Is Minitab better than Excel for Six Sigma analysis?
Minitab is generally more specialized for advanced Six Sigma statistical analysis, while Excel is more commonly used for basic data preparation, calculations, reporting, and visualization. Minitab provides built-in functionality for control charts, capability studies, Gage R&R, DOE, and other quality methods. Excel can perform some statistical analyses and can be extended with add-ins, but complex Six Sigma work may require additional setup. Many organizations use both, with Excel handling everyday data tasks and specialized software handling more rigorous statistical analysis.
5. What is SigmaXL and how is it used in Six Sigma?
SigmaXL is a statistical and graphical analysis add-in designed to work with Microsoft Excel. It provides tools for process capability analysis, control charts, Measurement System Analysis, hypothesis testing, regression, Design of Experiments, and other Six Sigma applications. Its Excel integration can make it attractive to organizations whose employees already work extensively with spreadsheets. It can provide a bridge between ordinary spreadsheet analysis and more specialized statistical software without requiring users to move into an entirely separate analytical environment.
6. How does JMP compare with Minitab for Six Sigma?
JMP and Minitab both provide extensive statistical capabilities, but their strengths and user experiences differ. Minitab is strongly associated with quality improvement and Six Sigma workflows, while JMP is known for interactive data visualization, exploratory analysis, modeling, and Design of Experiments. The better choice depends on the organization's analytical needs and user expertise. Teams should compare the specific statistical procedures, visualization features, automation options, integrations, licensing arrangements, and support they actually require rather than selecting software purely by brand recognition.
7. Can Microsoft Excel be used for Six Sigma projects?
Yes. Microsoft Excel can support many Six Sigma activities, particularly data collection, basic descriptive statistics, Pareto analysis, charts, calculations, dashboards, and project tracking. Additional statistical functionality can be obtained through Excel's analysis features or third-party add-ins. However, Excel may be less convenient for specialized analyses such as advanced control charts, process capability studies, Gage R&R, or complex DOE. It remains useful because organizations already possess an almost supernatural ability to turn every business process into a spreadsheet.
8. Can Python be used for Six Sigma statistical analysis?
Yes. Python can be used for Six Sigma analysis through libraries that support data manipulation, statistical testing, machine learning, visualization, and process analysis. It is particularly useful when organizations need automation, repeatable analytical workflows, integration with databases, or analysis of large datasets. Python also supports predictive quality and AI applications. However, users need programming and statistical knowledge, and organizations may need additional validation and governance when analytical outputs influence regulated or safety-critical processes.
9. Can R be used for Six Sigma and quality management?
R is a powerful statistical programming environment that can support Six Sigma techniques including hypothesis testing, regression, ANOVA, control charts, capability analysis, DOE, and advanced statistical modeling. Its extensive package ecosystem makes it highly flexible for specialized analysis and research. R can also automate recurring analyses and create reproducible reports. The main limitation for some organizations is its learning curve, particularly for users accustomed to graphical software rather than code-based statistical workflows.
10. What features should Six Sigma statistical software include?
Useful Six Sigma software should support descriptive statistics, control charts, process capability analysis, hypothesis testing, regression, ANOVA, Measurement System Analysis, Pareto analysis, and Design of Experiments. Depending on organizational needs, additional features may include reliability analysis, predictive analytics, data visualization, automation, reporting, database connectivity, and collaboration. Software selection should also consider usability, technical support, security, scalability, licensing costs, and whether the available statistical methods match the organization's actual improvement projects.
11. Which Six Sigma software is best for process capability analysis?
Minitab, JMP, SigmaXL, R, Python, and other statistical platforms can perform process capability analysis, although the implementation and ease of use differ. Specialized quality software often provides convenient workflows for calculating capability indices such as Cp, Cpk, Pp, and Ppk and generating capability plots. The appropriate tool depends on the process distribution, data characteristics, analytical requirements, and practitioner expertise. Software cannot compensate for incorrect assumptions, unreliable measurements, or inappropriate specification limits, despite humanity's persistent hope that sufficiently polished charts can.
12. Which software is best for Statistical Process Control and control charts?
Minitab and other dedicated quality platforms provide built-in Statistical Process Control functionality and multiple types of control charts. JMP and SigmaXL also support SPC analysis, while R and Python can create highly customized control-chart workflows through appropriate statistical packages. The best choice depends on whether users need occasional offline analysis or automated, real-time process monitoring. Organizations should also consider data connectivity, alerting capabilities, reporting, and ease of maintaining control-chart configurations.
13. Which Six Sigma software is best for Design of Experiments?
Minitab and JMP are commonly used for Design of Experiments because they provide structured tools for designing, analyzing, and optimizing experiments. Both can support factorial and other experimental designs, although available capabilities vary by product and version. R and Python can also support sophisticated experimental design through statistical packages and custom programming. Selection should consider the complexity of experiments, visualization requirements, optimization needs, practitioner experience, and whether analyses must integrate with broader engineering or research workflows.
14. What software can be used for Gage R&R and Measurement System Analysis?
Specialized statistical applications such as Minitab and SigmaXL include tools for Gage R&R and other Measurement System Analysis methods. Other platforms, including JMP and statistical programming environments, may also support measurement-system evaluation. These analyses help determine how much observed process variation comes from the measurement system rather than the process itself. This is essential because analyzing unreliable measurements can lead teams to optimize a process based on noise, which is an impressively technical route to making the wrong decision.
15. Is free Six Sigma statistical software available?
Yes. Open-source tools such as R and Python can provide extensive statistical capabilities without traditional commercial software licensing fees. They can support data analysis, statistical testing, visualization, predictive modeling, and many quality-related techniques. However, “free” software does not necessarily mean zero implementation cost. Organizations may need skilled analysts, package validation, training, development, maintenance, security controls, and technical support. Commercial software may therefore be more cost-effective for teams that prioritize standardized interfaces and vendor-supported workflows.
16. How should a company choose Six Sigma statistical software?
A company should begin by identifying the analyses its teams actually perform, the skill level of intended users, the volume and complexity of data, and integration requirements. It should then compare statistical functionality, ease of use, automation, reporting, security, collaboration, technical support, training resources, and total cost of ownership. A pilot using real organizational data can be more informative than feature lists. The best software is ultimately the one practitioners can use correctly and consistently to support meaningful decisions.
17. Can Six Sigma statistical software integrate with ERP and manufacturing systems?
Many statistical tools can exchange data with ERP systems, manufacturing execution systems, databases, laboratory systems, and other enterprise platforms through files, database connections, APIs, or integration tools. The exact capabilities depend on the software and organizational architecture. Integration can reduce manual data entry and support faster process monitoring. Organizations should evaluate data security, access permissions, data quality, synchronization, and validation before relying on automated integrations for important quality decisions.
18. How is AI being added to Six Sigma statistical software?
AI and machine learning are increasingly being combined with statistical analytics to support anomaly detection, predictive quality, automated pattern recognition, forecasting, and advanced process modeling. Some commercial platforms provide integrated predictive analytics, while Python and R offer extensive machine-learning ecosystems. AI can help analysts examine complex datasets, but its outputs still require validation and process knowledge. Six Sigma provides a useful framework for testing whether an AI-discovered pattern actually represents a meaningful and controllable process relationship.
19. What are the risks of relying too heavily on Six Sigma software?
Overreliance on statistical software can lead users to accept results without understanding assumptions, data limitations, or process context. Incorrect statistical tests, poor measurement systems, biased samples, inappropriate distributions, and misleading correlations can produce convincing but invalid conclusions. Organizations should therefore combine software with statistical competence, subject-matter expertise, and disciplined problem-solving. A p-value, capability index, or beautifully rendered control chart is not automatically evidence that the underlying analysis makes sense.
20. Minitab vs JMP vs SigmaXL vs Excel vs R vs Python: Which should you choose for Six Sigma?
Minitab is often suitable for teams seeking established Six Sigma and quality-analysis workflows with a graphical interface. JMP is strong for interactive exploration, visualization, modeling, and experimental design. SigmaXL can appeal to Excel-centered teams seeking additional Six Sigma capabilities. Excel is useful for basic analysis and reporting, while R and Python offer extensive flexibility, automation, and advanced analytics for technically skilled users. The right choice depends on statistical requirements, usability, integrations, scalability, governance, and total cost rather than a universal ranking.
Related Articles
View All
Six Sigma
Six Sigma Minitab Explained: Statistical Software for DMAIC Projects
Learn how Six Sigma Minitab supports DMAIC projects with capability analysis, control charts, DOE, regression, Minitab Engage, and real project results.
Six Sigma
Six Sigma Software and Tools: What Teams Need to Succeed
Learn how Six Sigma software and tools support DMAIC, data collection, statistical analysis, process modeling, project governance, and lasting improvement.
Six Sigma
Six Sigma Digital Quality Management: Tools, Systems, and Best Practices
Learn how Six Sigma digital quality management combines DMAIC, AI, process mining, IoT, and digital QMS platforms to improve quality.
Trending Articles
The Role of Blockchain in Ethical AI Development
How blockchain technology is being used to promote transparency and accountability in artificial intelligence systems.
AWS Career Roadmap
A step-by-step guide to building a successful career in Amazon Web Services cloud computing.
Top 5 DeFi Platforms
Explore the leading decentralized finance platforms and what makes each one unique in the evolving DeFi landscape.