

Six Sigma Statistics Explained for Non-Statisticians
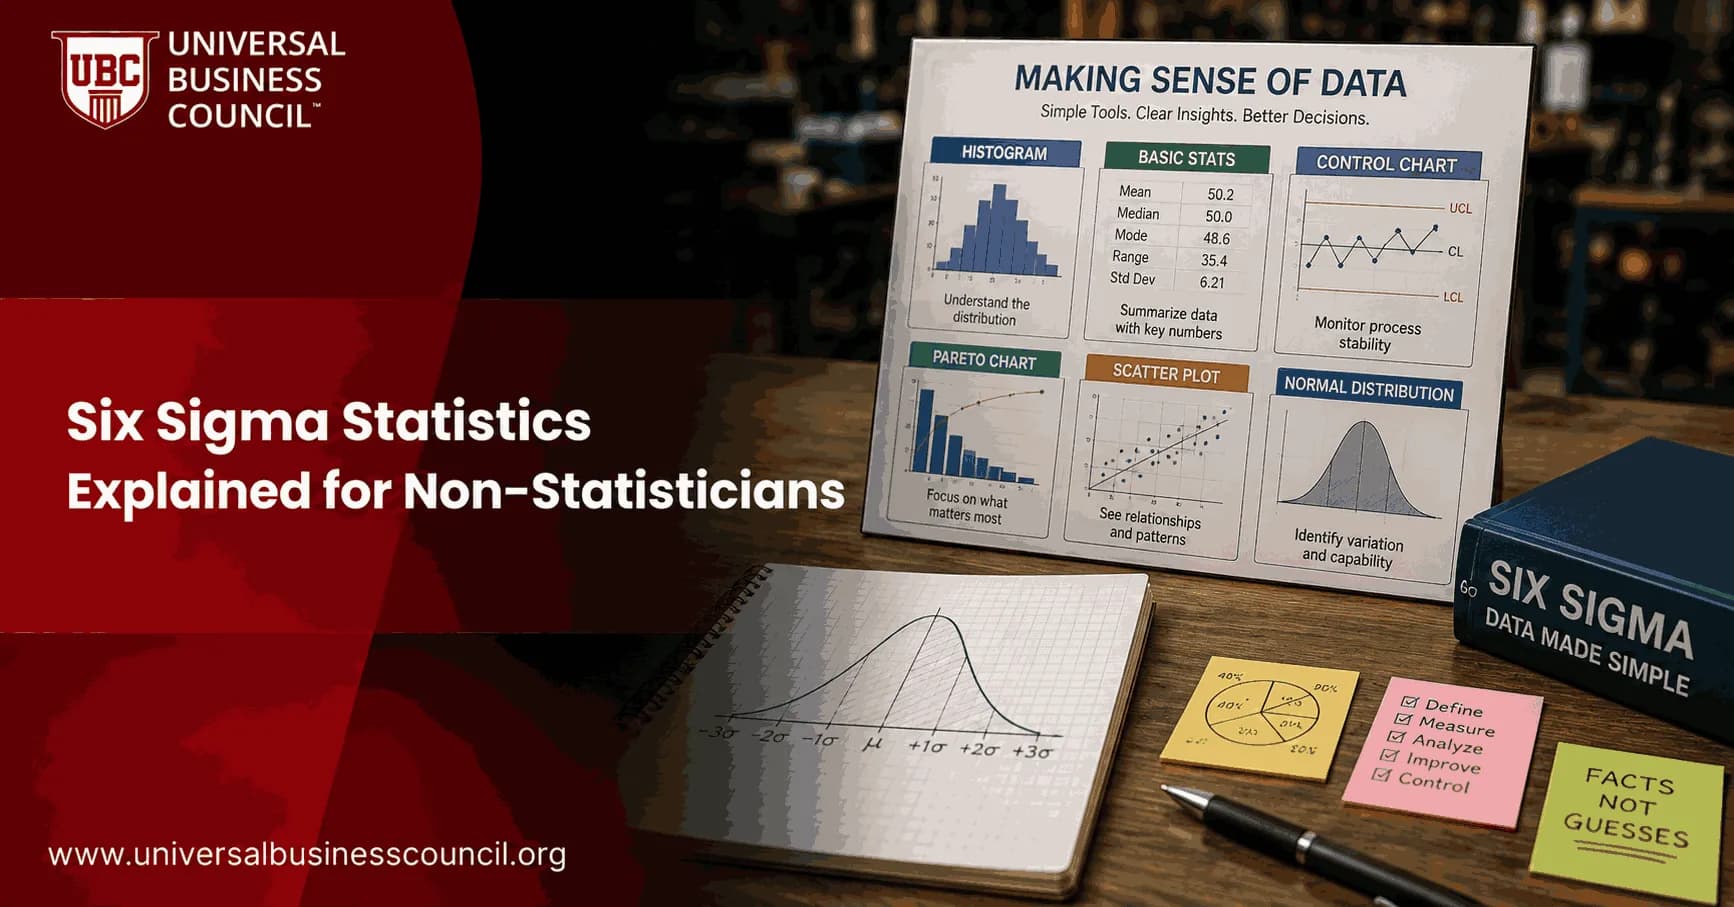
Six Sigma statistics are not about turning every manager, developer, or operations lead into a statistician. They are about making variation visible, measuring defects clearly, and deciding which process changes deserve attention. If you can read a dashboard, question a trend, and ask why a number moved, you can use the core ideas. Professionals building this fluency often start with a focused credential like the Certified Six Sigma Expert program, since knowing which statistic answers which business question is what actually makes a dashboard useful.
The practical logic is simple. Your result, often called Y, is driven by inputs, often called Xs, plus noise you cannot fully control. If customer complaints rise, the answer is rarely "people made mistakes." Look for the input factors: handoff time, unclear requirements, machine settings, batch size, queue length, code review quality, or a supplier change.

What Six Sigma Statistics Actually Measure
Six Sigma is a structured improvement method built to reduce variation and defects. Most projects follow DMAIC:
Define: state the problem and what success looks like.
Measure: collect current process data.
Analyze: identify likely root causes.
Improve: test and implement fixes.
Control: monitor the process so the gains hold.
Statistics sit mostly in Measure and Analyze, but the decisions are business decisions. A t-test will not tell you whether a customer will forgive a late delivery. It will tell you whether the new process probably changed average delivery time, or whether the improvement may just be random noise. Turning that statistical read into an actual business decision is a leadership skill, which is why many practitioners pair Six Sigma training with broader Management Certifications, covering the judgment and stakeholder communication needed to act on a p-value rather than just report it.
Start With the Type of Data
Before choosing a chart or a calculation, ask what kind of data you have.
Continuous data: time, temperature, weight, transaction value, page load speed, or call duration.
Discrete or attribute data: defect counts, pass or fail results, complaint categories, or the number of rejected forms.
This matters more than people expect. Do not force a pass or fail metric into a chart meant for continuous measurements. I have watched a team burn a week debating an "average defect category," which means nothing. Count the categories instead, then use a Pareto chart.
Core Six Sigma Statistics in Plain English
Mean, median, and mode
The mean is the average. It is useful, but outliers distort it. If nine support tickets take 10 minutes and one takes 8 hours, the average looks worse than the normal experience.
The median is the middle value. Use it when data are skewed, such as delivery time, ticket age, or sales cycle length. The mode is the most frequent value, which is helpful for categories such as defect type or customer reason codes.
Range, IQR, and standard deviation
The range is the gap between the highest and lowest values. Quick. Crude.
The interquartile range, or IQR, shows the spread of the middle 50 percent of values. It is often better than range because one strange data point will not dominate it.
Standard deviation measures how tightly values cluster around the mean. In Six Sigma statistics this is a key idea, because defects happen when variation pushes a process outside its specification limits.
What Sigma Level Means
A sigma level describes how far the process average sits from the nearest specification limit, using standard deviation as the measuring unit. Higher sigma usually means fewer defects.
DPMO, or defects per million opportunities, expresses quality in operational terms. If an invoice has five chances for error and 320 invoices produce 18 total defects, the DPMO is:
18 divided by 1,600 opportunities, multiplied by 1,000,000 = 11,250 DPMO.
That number is easier to discuss with leadership than a distribution formula. It also prevents a common mistake: comparing two processes without accounting for how many defect opportunities each one has.
Capability Metrics: Cp and Cpk
Cp compares your process spread with the allowed specification width. It answers a single question: could this process fit inside the limits if it were centered properly?
Cpk goes further. It accounts for whether the process is off center. A process can show a decent Cp and a poor Cpk if the average has drifted toward one limit. That is the one managers should watch closely when customer tolerance is tight.
Variation: The Idea That Drives Everything
Six Sigma statistics treat variation as the main source of inconsistent quality. There are two broad types:
Common cause variation: normal fluctuation built into the process.
Special cause variation: an unusual event, such as a failed sensor, a bad supplier batch, or a software release that changed how a workflow behaves.
Control charts help you tell the difference. Do not redesign a whole process because of one bad Tuesday. And do not ignore eight rising points in a row because each point is still "within target." That pattern is often the early warning.
Hypothesis Tests Without the Headache
Hypothesis testing helps you decide whether a suspected cause is likely to matter.
t-test: compare two averages, such as cycle time before and after a staffing change.
Chi-square test: compare counts or proportions, such as defect types by supplier.
ANOVA: compare more than two groups, such as three machine settings or four regional teams.
The question is not "What is the formula?" The better one is: do we have enough evidence to act? A p-value supports judgment. It does not replace it.
Where Six Sigma Statistics Are Used Now
Six Sigma began in manufacturing, but the same statistical thinking now shows up in healthcare, financial operations, software delivery, and service management. Clinical laboratories use sigma metrics to judge whether test methods meet allowable error requirements at medical decision points. Service teams use Pareto charts to find the complaint categories that create the most rework. IT teams track incident recurrence, deployment defects, and lead time variation.
Software has lowered the barrier. Tools such as Minitab, JMP, Excel, and Power BI, along with process mining platforms, can build charts and run tests. Your job is to understand the process, clean the definitions, and challenge the interpretation. Bad labels create bad statistics. Always check how the data were captured. When bad labels trace back to disconnected systems that will not agree on a shared defect definition in the first place, a Deep Tech Certification from Blockchain Council can help teams understand how reliable, traceable data pipelines are actually built, since a control chart is only as trustworthy as the data feeding it.
How Non-Statisticians Should Work With the Numbers
Define the defect before you collect any data. Ambiguous definitions ruin projects.
Separate continuous data from count data.
Use visuals first: histogram, Pareto chart, box plot, run chart, and control chart.
Ask whether variation is stable before comparing averages.
Partner with a Black Belt, analyst, or statistician for advanced tests.
Translate every metric into a decision: stop, monitor, improve, or redesign.
If you are building capability here, look at Universal Business Council training in Six Sigma, quality management, business analytics, and operations management as connected learning paths. For project leaders, a Green Belt level path is usually the right starting point. For enterprise improvement roles, move toward Black Belt level study after you have led real DMAIC work.
Next Step
Pick one process this week. Define one Y, list the likely Xs, and build a simple Pareto chart or run chart from recent data. Then ask: is this common variation, or is something specific driving the defect pattern? That question is where Six Sigma statistics start to pay off. If your data keeps arriving late, mislabeled, or split across tools that will not reconcile, a Tech Certification from Global Tech Council is worth adding to your plan, since some statistics problems are really systems integration problems in disguise.
FAQs
1. What is Six Sigma statistics in simple terms?
Six Sigma statistics is the use of data and statistical methods to understand how a process performs, how much it varies, and what causes defects or poor results.
The basic idea is straightforward:
Collect data → Measure variation → Identify causes → Improve the process → Verify results
You do not need to be a statistician to use Six Sigma. Most practical Six Sigma work involves understanding a manageable set of concepts such as averages, variation, distributions, capability, sampling, and relationships between variables.
2. Why is statistics important in Six Sigma?
Statistics helps Six Sigma teams separate facts from assumptions. Without data, a team may change a process because someone believes a particular factor causes defects. Statistical analysis helps determine whether the evidence actually supports that belief.
Statistics is used to answer questions such as:
Is the process improving?
Is variation increasing?
Which factors influence defects?
Is the observed change real or random?
Can the process consistently meet customer requirements?
Essentially, statistics prevents the loudest person in the meeting from automatically becoming the analytical method.
3. Do you need advanced math to learn Six Sigma statistics?
No. Most Six Sigma practitioners do not calculate complicated statistics manually. Software such as Minitab, JMP, Excel, Python, or statistical platforms can perform the calculations.
The more important skill is understanding:
Which statistical tool should I use?
and:
What does the result mean for the process?
Knowing that a p-value is 0.018 is considerably less useful if nobody understands what decision that number supports.
4. What is the mean in Six Sigma?
The mean is the arithmetic average of a set of observations.
The formula is:
Mean = Sum of all observations ÷ Number of observations
Suppose processing times are:
10, 12, 11, 13, 14 minutes.
The mean is:
(10 + 12 + 11 + 13 + 14) ÷ 5 = 12 minutes
Six Sigma teams use the mean to estimate the typical or central performance of a process.
5. What are median and mode in Six Sigma?
The median is the middle value after observations are arranged in order. The mode is the value occurring most frequently.
Suppose the data is:
2, 3, 3, 4, 20
Mean = 6.4
Median = 3
Mode = 3
The unusually large value of 20 pulls the mean upward. This illustrates why Six Sigma practitioners should examine the distribution rather than blindly reporting averages and fleeing the scene.
6. What is variation in Six Sigma?
Variation describes differences among process outputs.
Suppose a machine should produce components measuring 50 mm. Actual measurements might be:
49.8, 50.1, 49.9, 50.3, 49.7
Those differences represent process variation.
Six Sigma focuses heavily on variation because customers usually need processes to produce consistent results, not merely a satisfactory average.
7. What is standard deviation in Six Sigma?
Standard deviation measures how spread out observations are around their mean.
A small standard deviation generally indicates that process results are tightly clustered.
A large standard deviation indicates greater variation.
For example:
Process A: Mean = 100, SD = 1
Process B: Mean = 100, SD = 8
Both processes have exactly the same average, but Process A is considerably more consistent.
This is why averages alone can conceal spectacular amounts of operational misery.
8. What is variance in Six Sigma?
Variance is another measure of process spread. Mathematically, variance is the square of standard deviation:
Variance = Standard Deviation²
If standard deviation is 4:
Variance = 4² = 16
Variance is particularly important in statistical calculations such as ANOVA. In everyday Six Sigma communication, standard deviation is often easier to interpret because it uses the same measurement units as the original data.
9. What is a normal distribution in Six Sigma?
A normal distribution is a symmetrical, bell-shaped probability distribution frequently used in statistical analysis.
For an ideal normal distribution, approximately:
68% of observations fall within ±1 standard deviation of the mean.
95% fall within roughly ±2 standard deviations.
99.7% fall within roughly ±3 standard deviations.
However, Six Sigma practitioners should test whether normality is a reasonable assumption instead of automatically attaching a bell curve to everything possessing numbers.
10. What does sigma mean in Six Sigma?
The Greek letter sigma (σ) commonly represents standard deviation, a measure of variation.
In capability discussions, a higher sigma level generally indicates that process performance is better relative to specification limits and produces fewer defects.
The famous Six Sigma benchmark is conventionally associated with approximately 3.4 defects per million opportunities (DPMO) when the traditional 1.5-sigma long-term shift convention is applied.
That convention matters. Without it, the defect probability associated with six standard deviations is different.
11. What is a defect in Six Sigma statistics?
A defect is a failure to satisfy a defined customer, product, service, or process requirement.
Examples include:
Incorrect invoice
Damaged component
Late shipment
Missing information
Measurement outside specification
Failed transaction
A single unit may contain multiple opportunities for defects. Six Sigma therefore distinguishes among units, defects, and defect opportunities when calculating quality metrics.
12. What is DPMO in Six Sigma?
DPMO means Defects Per Million Opportunities. It standardizes defect performance across processes with different numbers of opportunities.
The formula is:
DPMO = Defects ÷ (Units × Opportunities per Unit) × 1,000,000
Suppose 10,000 forms each have five defect opportunities and 100 total defects are found:
DPMO = 100 ÷ (10,000 × 5) × 1,000,000
DPMO = 2,000
Lower DPMO generally indicates better quality performance.
13. What is process capability in Six Sigma?
Process capability evaluates whether a process can consistently produce output within specification limits.
Suppose a component must measure:
10.0 ± 0.5 mm
Then:
LSL = 9.5 mm
USL = 10.5 mm
Capability analysis compares the process distribution with these specification limits.
A capable process has sufficiently low variation and appropriate centering to meet requirements consistently.
14. What are Cp and Cpk in Six Sigma?
Cp and Cpk are common process capability indices.
Cp compares the width of the specification range with the natural process spread:
Cp = (USL − LSL) ÷ 6σ
Cpk also considers how well the process is centered within the specifications.
A process can therefore have a good Cp but a poor Cpk if its variation is reasonably small but its mean is too close to one specification limit.
In plain language:
Cp → Could the process fit?
Cpk → Is the actual process fitting properly?
15. What is statistical process control in Six Sigma?
Statistical Process Control (SPC) uses statistical techniques, especially control charts, to monitor process behavior over time.
SPC helps distinguish between:
Common-cause variation: Natural variation inherent in the current process.
Special-cause variation: Unusual variation caused by identifiable events or changes.
This distinction prevents teams from adjusting a stable process every time a number wiggles slightly, a surprisingly popular way to manufacture additional variation.
16. What is the difference between control limits and specification limits?
This distinction is essential.
Specification limits come from customer, engineering, regulatory, or business requirements.
Control limits are calculated from actual process data and describe expected process behavior.
Therefore:
Specifications → What the process must achieve
Control limits → What the process is currently doing
A process can be statistically stable but incapable of meeting specifications. Stability does not automatically mean good performance.
17. What is hypothesis testing in Six Sigma?
Hypothesis testing helps determine whether observed differences or relationships are supported by sufficient statistical evidence.
Suppose a team changes a machine setting and observes lower cycle time.
The hypotheses might be:
H₀: The new setting does not improve average cycle time.
H₁: The new setting improves average cycle time.
Statistical testing evaluates whether the observed improvement is sufficiently inconsistent with the null hypothesis under the model assumptions.
This helps teams avoid declaring victory because Tuesday happened to be unusually cooperative.
18. What is a p-value in Six Sigma?
A p-value measures how compatible the observed data, or something more extreme under the test definition, is with the null hypothesis assuming that hypothesis and the statistical model are true.
A commonly selected significance level is:
α = 0.05
If:
p < 0.05
the team may reject the null hypothesis at that chosen significance level.
But a small p-value does not tell you that the improvement is large, important, or profitable. Six Sigma teams should examine effect size, confidence intervals, process impact, and practical significance alongside statistical significance.
19. What are correlation and regression in Six Sigma?
Correlation measures the strength and direction of association between variables.
For example:
Temperature ↑ → Defect rate ↑
A correlation coefficient close to +1 indicates a strong positive linear relationship, while one close to −1 indicates a strong negative linear relationship. A value near zero indicates little linear association.
Regression analysis goes further by modeling how one or more input variables relate to an outcome.
For example:
Defect Rate = f(Temperature, Speed, Pressure)
Regression can help identify important process drivers and predict outcomes.
However:
Correlation ≠ causation
Two variables moving together does not prove that one causes the other.
20. What Six Sigma statistics should beginners learn first?
Beginners should focus on a practical sequence:
Descriptive statistics
Mean → Median → Range → Variance → Standard deviation
↓
Process distributions
Histograms → Normal distribution → Outliers
↓
Process performance
Defects → Yield → DPMO → Sigma level
↓
Process stability
Run charts → Control charts → Common vs special causes
↓
Process capability
Specification limits → Cp → Cpk → Pp → Ppk
↓
Statistical inference
Sampling → Confidence intervals → Hypothesis tests → p-values
↓
Relationship analysis
Correlation → Regression → ANOVA
The goal is not to memorize a collection of formulas. The goal is to connect statistics to process decisions:
What is happening? → How much does it vary? → Is the process stable? → Can it meet requirements? → What causes the problem? → Did our improvement actually work?
That is Six Sigma statistics in its useful form.
A capable practitioner does not need to become a professional statistician. They need enough statistical understanding to ask the right question, choose an appropriate method, check its assumptions, interpret the evidence correctly, and translate the result into a process decision.
Software can calculate the decimal places. Humans still have to decide whether those decimal places mean anything.
Related Articles
View All
Six Sigma
Six Sigma Minitab Explained: Statistical Software for DMAIC Projects
Learn how Six Sigma Minitab supports DMAIC projects with capability analysis, control charts, DOE, regression, Minitab Engage, and real project results.

Six Sigma
Design for Six Sigma Explained: When to Use DFSS Instead of DMAIC
Design for Six Sigma helps teams design new products, services, and processes to meet quality targets from launch instead of fixing defects later.

Six Sigma
Six Sigma DMADV Explained: Define, Measure, Analyze, Design, Verify
Six Sigma DMADV explained through its five phases, practical use cases, DMAIC comparison, and how professionals apply it to design for quality.
Trending Articles
The Role of Blockchain in Ethical AI Development
How blockchain technology is being used to promote transparency and accountability in artificial intelligence systems.
AWS Career Roadmap
A step-by-step guide to building a successful career in Amazon Web Services cloud computing.
Top 5 DeFi Platforms
Explore the leading decentralized finance platforms and what makes each one unique in the evolving DeFi landscape.