

Responsible AI Metrics Dashboard: Designing a Practical Scorecard
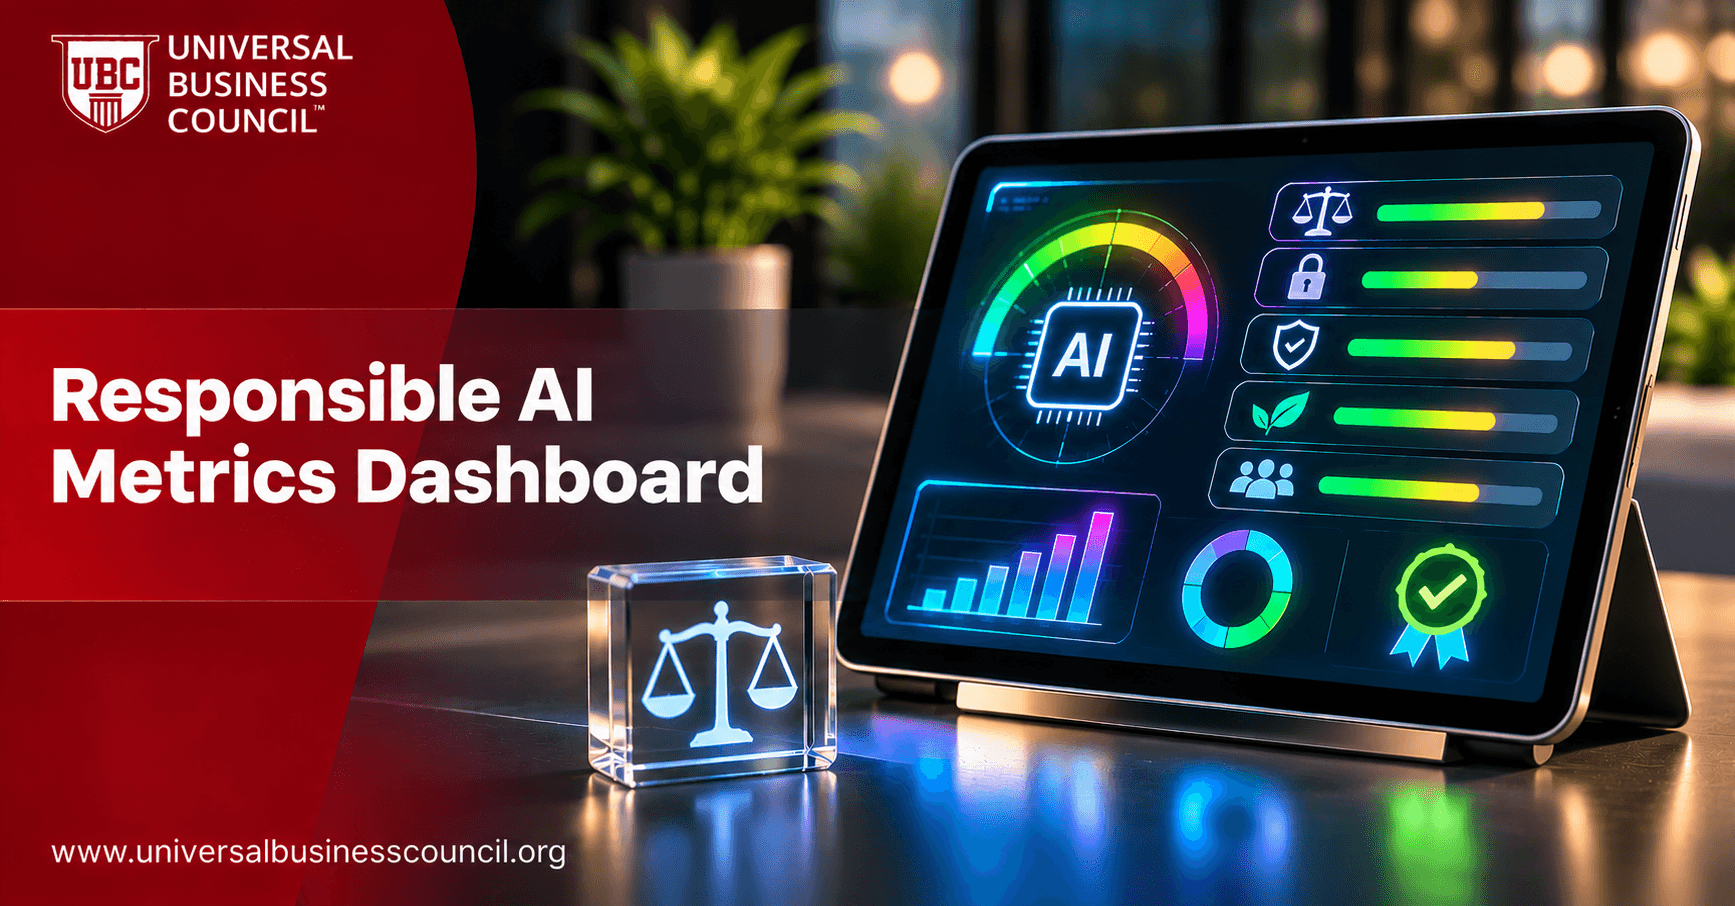
A good dashboard is a set of decisions disguised as charts. Every tile should exist because someone will act differently depending on what it shows. Responsible AI programs often collect plenty of numbers and still struggle to answer a board member's simple question: are we in control of our AI risk? A practical scorecard answers that question at a glance and lets specialists drill down to the detail. This guide explains how to design a responsible AI metrics dashboard, which indicators to include, how to present them for different audiences and how to keep the data trustworthy. For professional learning in the field, see the certified responsible AI expert certification. This is general information, not legal advice.
What is a responsible AI metrics dashboard?
A responsible AI metrics dashboard is a structured view of indicators that show how well AI systems and the governance program are meeting the organization's goals for fairness, safety, security, privacy, transparency and compliance. A scorecard is a compact version that summarizes status, trend and ownership for each indicator, often with simple red, amber and green ratings.

It differs from raw monitoring tools. Monitoring tools serve engineers watching systems minute by minute. A scorecard serves managers, risk teams and executives who must decide where to spend attention.
Start with audiences and decisions
Design from the user backward. Ask who will read the scorecard, what decisions they make and how often.
Executives and the board
They need a one-page view: overall status, the highest risks, trends, incidents and open actions. Keep it free of jargon.
Governance and risk teams
They need system-level detail, such as risk tiers, assessments completed, test results, overdue reviews and issues by owner.
Product and engineering teams
They need operational metrics for their own systems, including performance, drift, fairness and security signals, linked to thresholds and runbooks.
A layered design serves all three: a summary view on top, with drill-down to system and technical views underneath.
What to include
Choose a small number of indicators across a few categories, and avoid vanity metrics.
Program health indicators
These show whether governance is working. Examples include the share of AI systems recorded in the inventory, the share of higher-risk systems with completed impact assessments before launch, training completion, vendor reviews completed and the number of overdue actions.
System risk and performance indicators
For key systems, show performance against thresholds, drift status, fairness gaps, safety or harmful-output rates, security events and human override rates. Highlight systems that have breached a threshold.
Incidents and complaints
Include counts by severity, time to detect and resolve, near misses and complaints linked to AI. Trend lines are more informative than single numbers.
Compliance and assurance indicators
Show regulatory obligations tracked, audit findings open and closed, and exceptions granted. This supports regulator and auditor conversations.
Inventory coverage and assessments completed
Thresholds breached and time to resolve
Fairness, safety and security indicators for key systems
Incidents, near misses and complaints
Audit findings and overdue actions
Example scorecard layout
The table below shows a simple structure. Replace the examples with measures that fit your organization.
Area | Indicator | Owner | Status | Trend |
|---|---|---|---|---|
Governance | AI systems in inventory with named owner | Governance lead | Amber | Improving |
Governance | High-risk systems assessed before launch | Risk lead | Green | Stable |
Fairness | Outcome gaps within agreed threshold | System owner | Amber | Worsening |
Safety | Harmful output rate in sampled reviews | Product lead | Green | Stable |
Security | Open AI-related security findings | Security lead | Red | Improving |
Oversight | Override rate and review time | Operations lead | Amber | Stable |
Incidents | Open incidents by severity | Incident lead | Green | Improving |
Reading the example
Every row has an owner, a status and a trend. The status comes from defined thresholds, and a red or worsening item should lead to a named action. The values shown are illustrative only.
Designing for clarity and honesty
Presentation choices affect how people read the numbers.
Define each metric
Record what each indicator measures, how it is calculated, the data source, the threshold for each status and the owner. Without definitions, people argue about numbers instead of acting on them.
Show thresholds and trends
A number without a target or direction is hard to interpret. Show status against thresholds, recent trend and the date of last update. Avoid decoration, and use color consistently, with labels so that the dashboard is accessible to color-blind users.
Avoid misleading averages
Aggregate scores can hide the worst-performing systems and groups. Provide breakdowns by system, risk tier and group, and highlight outliers.
Be candid about limits
Note where data is incomplete, where measures are proxies and where there are known blind spots. A dashboard that looks perfect invites suspicion.
Making the data trustworthy
A scorecard is only as reliable as its inputs.
Automate collection where possible
Pull data from the inventory, pipelines, monitoring tools and ticketing systems so that figures are consistent and timely. Engineers who build these data flows benefit from strong technical foundations, which many develop through tech certifications.
Protect integrity and privacy
Control who can change data and definitions, keep an audit trail and avoid manual edits that cannot be traced. Tamper-evident approaches are explored in deep tech certifications. Apply privacy rules to any group-level data, and restrict access to sensitive breakdowns.
Assign ownership and review rhythm
Name a scorecard owner, set a reporting schedule and hold a regular review meeting where red items get actions. Confirm that those responsible for the data and decisions hold the qualifications they claim, with checks supported by HireValid.
Report externally with care
If you publish any metrics, make sure they are accurate, defined and not cherry-picked. A digital marketing course can help teams present data honestly and clearly to wider audiences.
Conclusion
A responsible AI metrics dashboard works when it is designed around decisions. Start with audiences, choose a small set of program, system, incident and compliance indicators, and give every metric a definition, threshold, owner and trend. Layer the views, be candid about limits and automate data collection with strong integrity controls. Review it on a set rhythm, and make sure red items lead to action.
Frequently asked questions
These are the questions teams ask most about responsible AI scorecards.
1. What is a responsible AI scorecard?
A compact view of indicators showing the status and trend of AI governance and risk.
2. How is it different from monitoring tools?
Monitoring serves engineers in real time, while a scorecard serves managers and leaders.
3. Who is the audience?
Executives, governance teams and product and engineering teams, each with a suitable layer.
4. How many metrics should it have?
A small, focused set tied to decisions.
5. What are program health indicators?
Measures of governance activity such as inventory coverage and assessments completed.
6. Which system indicators matter?
Performance, drift, fairness, safety, security and override rates.
7. What does red, amber and green mean?
Status against defined thresholds.
8. Who sets thresholds?
The system owner with risk, legal and governance input.
9. Why show trends?
Direction often matters more than a single number.
10. Why define each metric?
To avoid disputes about calculation and meaning.
11. Can averages mislead?
Yes. They can hide poor performance in some systems or groups.
12. Should we show data limits?
Yes. Honesty about gaps builds credibility.
13. How often should the scorecard be updated?
On a regular schedule set by risk, with alerts for serious issues.
14. Should data collection be automated?
Where possible, for consistency and timeliness.
15. How do we protect the data?
Control edits, keep audit trails and restrict sensitive breakdowns.
16. Who owns the scorecard?
A named owner, often in governance or risk.
17. What should happen to red items?
They should trigger named actions with owners and deadlines.
18. Can we publish the scorecard?
Publish only accurate, defined and appropriately summarized measures.
19. How do we make it accessible?
Use labels and patterns in addition to color.
20. How often should the design be reviewed?
Regularly, as systems, risks and decisions change.
Related Articles
View All
Artificial Intelligence
AI Fairness Audit Metrics: What to Measure and How to Interpret Results
Learn which fairness metrics are used in AI audits and how to interpret their results. Explore measures such as demographic parity, equal opportunity, equalized odds, and predictive parity, along with their applications, limitations, and role in identifying unfair outcomes across different groups.

Artificial Intelligence
Responsible AI Audit: Principles, Controls and Best Practices
Discover what a responsible AI audit involves and how organizations evaluate AI systems against principles of fairness, transparency, accountability, safety, and privacy. Learn about the audit process, key assessment areas, and how regular reviews help identify risks and strengthen responsible AI practices.

Artificial Intelligence
Responsible AI Training Program: Curriculum for Employees and Leaders
Learn how to develop a responsible AI training program that prepares employees and leaders to use AI safely and ethically. Explore essential curriculum topics, role-based learning, AI risk awareness, governance responsibilities, and practical training approaches that support responsible AI adoption across an organization.
Trending Articles
The Role of Blockchain in Ethical AI Development
How blockchain technology is being used to promote transparency and accountability in artificial intelligence systems.
AWS Career Roadmap
A step-by-step guide to building a successful career in Amazon Web Services cloud computing.
Top 5 DeFi Platforms
Explore the leading decentralized finance platforms and what makes each one unique in the evolving DeFi landscape.