No image
Suyash Raizada
Six Sigma Normal Distribution: Bell Curves in Process Data
Learn how Six Sigma normal distribution explains bell curves, process spread, Cp, Cpk, and when non-normal data need different capability methods.


Browse the latest six sigma articles, tutorials, and research from Universal Business Council.(145 articles)
Learn how Six Sigma normal distribution explains bell curves, process spread, Cp, Cpk, and when non-normal data need different capability methods.
Six Sigma variance shows how consistently a process performs. Learn how quality teams measure, interpret, and reduce variance across manufacturing, service, and IT.
Learn how Six Sigma standard deviation measures process variation, how to calculate it, and how it connects to defects, capability, control charts, and quality decisions.
Learn how Six Sigma mean, median, and mode guide process analysis, when to use each measure, and how to avoid misleading improvement decisions.
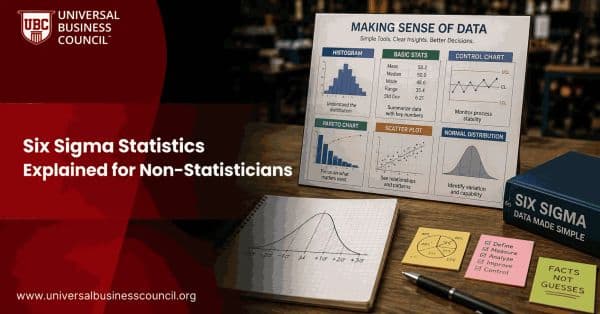
A plain-English guide to Six Sigma statistics, covering variation, DPMO, sigma level, Cp, Cpk, hypothesis tests, and practical use.

Learn what a Six Sigma control plan includes, why it prevents process backsliding, and how to build one that sustains DMAIC improvements.

Learn how Six Sigma Gauge R&R separates repeatability, reproducibility, and part variation so teams can judge whether measurement data is trustworthy.

Learn how Six Sigma Measurement System Analysis verifies data accuracy through Gage R&R, attribute MSA, audit expectations, and digital quality controls.

Learn how Risk Priority Number works in Six Sigma FMEA, how to calculate RPN, where it helps, and which mistakes to avoid in real process improvement work.

Learn how Six Sigma FMEA helps teams identify, prioritize, and prevent failures before they affect safety, quality, cost, or customers.

Learn how Six Sigma flowcharts map steps, decisions, and handoffs in DMAIC projects, with practical symbols, data points, and mapping tips.

Learn how Six Sigma scatter diagrams reveal positive, negative, nonlinear, and weak relationships so teams can test root-cause hypotheses with data.