
Suyash Raizada
Six Sigma Histograms: Understanding Process Distribution
Learn how Six Sigma histograms reveal process distribution, variation, skewness, and capability issues across DMAIC projects.


Browse the latest six sigma articles, tutorials, and research from Universal Business Council.(145 articles)
Learn how Six Sigma histograms reveal process distribution, variation, skewness, and capability issues across DMAIC projects.

Learn how Six Sigma check sheets collect real-time process data, support DMAIC, and help teams turn defects, delays, and events into evidence.

Learn how Six Sigma control charts monitor process stability, separate common and special cause variation, and support DMAIC control.

Learn practical Six Sigma brainstorming techniques for DMAIC, including brainwriting, reverse brainstorming, affinity diagrams, and prioritization.

Learn how Six Sigma 5 Whys works in DMAIC, when to use it, its limits, and how teams find actionable root causes with evidence.

Learn how the Six Sigma fishbone diagram supports root cause analysis, DMAIC, 5 Whys, and evidence-based corrective action across industries.

Learn how a Six Sigma Pareto chart ranks defects, costs, or delays so teams can focus on the vital few problems that drive most process loss.

Learn what Six Sigma CTQ means, how Critical-to-Quality metrics connect VOC to DMAIC, and see practical CTQ examples across manufacturing, healthcare, service, and digital operations.

Learn how Six Sigma Voice of Customer turns customer feedback into CTQs, measurable requirements, and process controls that improve quality and satisfaction.
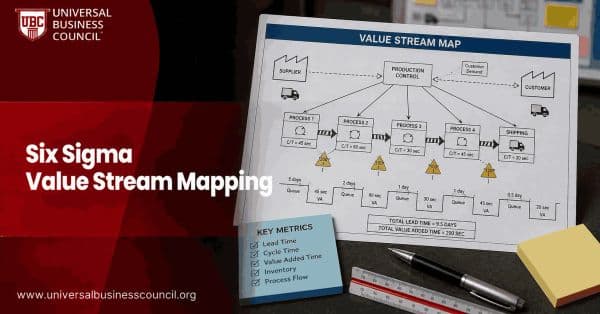
Learn how Six Sigma value stream mapping helps teams expose waste, locate bottlenecks, reduce defects, and improve lead time with DMAIC.

Learn how Six Sigma process mapping uses SIPOC, swimlane diagrams, flowcharts, and value stream maps to expose waste and improve workflows.

Learn how Six Sigma SIPOC maps suppliers, inputs, process steps, outputs, and customers to define scope, reduce rework, and support DMAIC projects.